It is well known that by the 1990’s, if not before, sampling from 1+100-banks became an industry standard practice for random digit dialing (RDD) telephone surveys. For many years, survey researchers acted on the belief that this frame missed only around 5 percent of all telephone households; use of this frame was based on the reasoning that survey estimators are unlikely to be badly biased if the level of undercoverage is so low. The difference between the means of households in 1+ 100-banks and in 0-banks would have to be very large indeed, which seemed unlikely in most applications, to introduce more than a trivial bias into survey statistics.
It is equally well known and undeniable that circumstances have changed. Today, the conventional sampling frame omits all cell-phone-only households, estimated to represent about 20.2 percent of all households in America ( http://www.cdc.gov/nchs/data/nhis/earlyrelease/wireless200905.htm). In addition, the frame continues to miss households that have an unlisted landline telephone number located within a 0-bank and there is new uncertainty about the extent of the misses.
Two recent studies have re-estimated the percent of landline households missed by the 1+ sampling frame. Fahimi, Kulp, and Brick ( http://surveypractice.files.wordpress.com/2008/09/survey-practice-september-2008.pdf) found that the undercoverage rate “… has now peaked to about 20 percent …” and Boyle, Bucuvalas, Piekarski, and Weiss ( http://surveypractice.files.wordpress.com/2009/02/survey-practice-january-2009.pdf) determined that “… 5.0% of working residential landline telephone numbers are located in zero banks.” The large range, 5 percent to 20 percent, implied by these two studies leaves the current status of the coverage of the 1+sampling frame a bit unsettled and motivates the current work.
We provide a third estimation of the 0-bank population. At the outset, we assert that any study of this kind is likely to be sensitive to assumptions and initial conditions, including the exact composition of the 0-bank sampling frame, the time lag between the creation of the sampling frame and the implementation of the study, the calling rules employed in resolving cases, the questions asked of respondents, and the assumptions used in estimation to account for any residual unresolved cases. As a consequence, in Section 2, we describe in detail our initial conditions and procedures. In Section 3, we illustrate the uncertainty of our findings by offering several estimates of the undercoverage of the 1+ sampling frame corresponding to alternative assumptions used in estimation. We close with a brief summary.
Our work was supported by funds from the National Immunization Survey, a large RDD survey conducted by the Centers for Disease Control and Prevention to assess the vaccination status of young children age 19–35 months and of teens age 13–17 years.
Design of Study
Sampling Frame and Design. The sampling frame for the study consisted of all possible telephone numbers in telephone exchanges potentially containing residential landlines. These telephone exchanges were identified using the January 2009 vintage of Telcordia’s “NPA/NXX Active Code List – Thousand Blocks” (NNACL-TB). There were 915,116 such exchanges in the 51 states with a central office code type of wireline or partially wireline (COCTYPE=EOC), yielding a sampling frame of 915,116,000 telephone numbers.
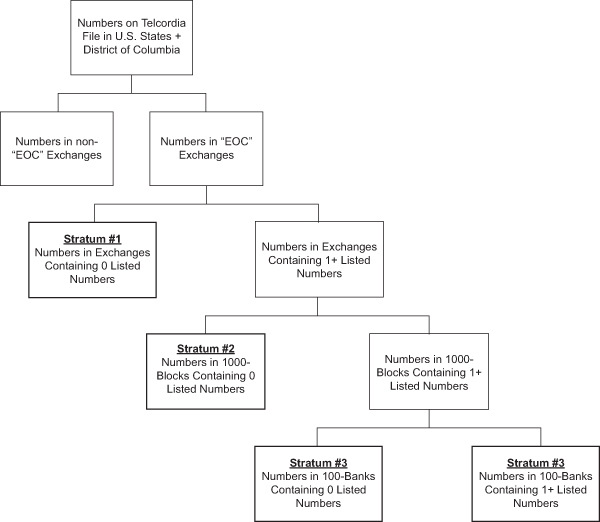
As shown in Figure 1, we divided the sampling frame into four strata:
- Stratum #1: Telephone numbers within telephone exchanges that contain zero listed telephone numbers.
- Stratum #2: Telephone numbers within blocks of 1000 telephone numbers that contain zero listed telephone numbers but within telephone exchanges that contain at least one listed telephone number.
- Stratum #3: Telephone numbers within banks of 100 telephone numbers that contain zero listed telephone numbers but within blocks of 1000 telephone numbers that contain at least one listed telephone number.
- Stratum #4: Telephone numbers within banks of 100 telephone numbers that contain at least one listed telephone number. This is the traditional list-assisted RDD telephone survey sampling frame.

We selected systematic samples of 15,000 telephone numbers from each of the four strata, yielding a total sample size of 60,000.
The frame and sample sizes by stratum are shown in Table 1.
Calling Rules. All calls were made between April 29 and May 31, 2009 using NORC’s predictive dialer. We worked the sample in random replicates, each of which contained 250 cases from each stratum. We managed the cases in such a way that the interviewers did not know the strata from which the telephone numbers were selected, thus guarding against any expectations they may otherwise have had about the viability of the cases.
Our intention was to conduct a maximum of 6 calls per case, spreading the call attempts across weekday and weekend shifts. We finalized cases (i.e., not dialed again) under the following conditions:
- Any human contact (all calls involving completed interviews, and those where we reached a human but were unable to complete the interview, including refusals and language barriers);
- Resolution of household status or other known status could be determined from an answering machine or voicemail message (If the message referred to reaching “the family or household of…”, we would code the case as a household; if it referred to reaching a business, cell phone, or other non-household, we would code it into the appropriate non-household category. On the other hand, if the message was ambiguous, e.g., just a person’s name was given, we would not necessarily finalize the case but would schedule it for further dials.);
- The second occurrence of a disconnect signal;
- The third occurrence of a data line signal;
- Any case remaining unresolved as to residential status after a total of 6 valid call attempts.
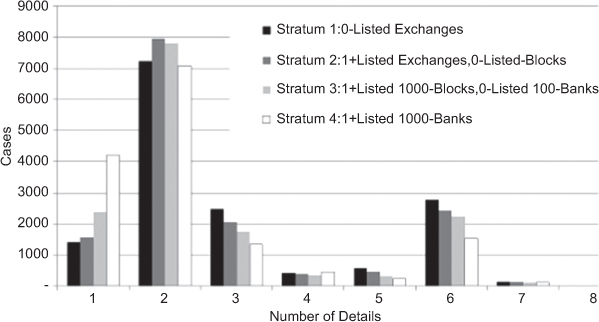
Figure 2 gives the frequency distribution of our 60,000 sample cases by number of dials before finalization. The pattern is what we would expect:
- Stratum 4 has the greatest number of cases finalizing on the first dial, since we would finalize on the first dial if we were able to achieve a definite household/non-household determination (mostly by speaking with someone or by getting an unambiguous answering machine message).
- The very large group of cases that we finalized on the 2nd dial include cases with two successive disconnects.
- The group of cases finalizing on the 3rd dial include those for which we recorded three data lines or fax signals.
- The small group of cases finalizing on the 4th and 5th dial included cases with two disconnects or two data line or fax signals plus an additional non-contact event (such as a busy signal).
- The group of cases finalizing on the 6th dial are those for which we reached the maximum number of dials (mostly all dials being ring-no-answers, or engaged, or answering machines with no unambiguous indication of household status).
- The few cases finalizing on the 7th or 8th dial were those where an earlier dial was invalid (for example, where the dial was abandoned before the outcome could be determined).

Questionnaire. Upon reaching a respondent, we conducted a brief interview in which we tried to confirm that the case was a private residence and not a business, cell-phone, or some other type of telephone number. We greeted the respondent and asked “Is this a business or cell phone?” Those respondents stating that the number was a cell-phone were thanked for their time and the call was ended. Those stating that the number was a business were asked a follow-up question to confirm that there was no residence at that phone number and then the interview was ended. Those respondents stating that the number was neither a business nor a cell-phone were asked explicitly to confirm the number belonged to a private residence. The interview ended when the respondent confirmed a private residence. If the respondent did not confirm a private residence, we asked a final follow-up question about what sort of phone number it was.
Results
Based on the aforementioned calling rules and the responses obtained in our brief interviews of respondents, we classified each sampled telephone number as a residential landline, as a cell phone, as a business or other nonresidential entity, as non-working, or as unresolved. In what follows, we discuss results for alternative approaches to estimation, making different assumptions about the nature of the unresolved cases.
First Approach. We begin by adopting the reasonably standard assumption in RDD telephone surveys that the unresolved cases are distributed like the resolved ones. In particular we assume that unobserved residential numbers as a proportion of total unresolved numbers is equal to observed residential numbers as a proportion of total resolved numbers. The corresponding results are shown in Table 2. The working residential landline rate among the resolved telephone numbers (column H) ranged from about 17.9 percent in the 1+ Listed 100-Bank stratum to 0.5 percent in the 0-Listed Exchanges stratum. By applying the observed working residential landline rates to the universe of telephone numbers, we get estimates of the total number of residential landlines (column I). Assuming there are 1.03 landlines per landline household [1], we convert the estimates of residential landlines to estimates of the number of landline households (column K). The estimated distribution of landline households (column L) reveals that the 1+ Listed 100-Bank stratum contains 93.3 percent of landline households. Thus, the standard RDD sampling frame omits coverage of an estimated 6.7 percent of landline households.
Although the primary purpose of this study is to estimate the distribution of landline households across the four strata, given the current assumptions we estimate the number of landline households in the U.S. to be 54,704,336 (column K). Yet according to the 2007 American Housing Survey (AHS) ( http://www.census.gov/hhes/www/housing/ahs/ahs07/ahs07.html), there are 110,692,000 total households in the U.S., and according to the National Health Interview Survey (NHIS) ( http://www.cdc.gov/nchs/data/nhis/earlyrelease/wireless200905_tables.htm), in the second half of 2008 20.2 percent of households had only wireless telephones and 1.9 percent had no telephone whatsoever. Because these data imply that there are roughly 86.2 million landline households in the U.S., we conclude that this first approach to estimation likely underestimates the total number of landline households. While this finding does not necessarily mean that the estimated distribution of landline households across the four strata is biased, it does suggest that this method is allocating too many of the unresolved telephone numbers to non-working or non-landline status.
Second Approach. As a second approach, we treat the resolution of residential landline status as a two-step process, the first step being the resolution of the telephone number as working or non-working and the second being the resolution of the working telephone number as a residential landline, a cell phone, or a business/nonresidential phone. At the first step, we assume that unobserved working telephone numbers as a proportion of total unresolved numbers equals the observed working numbers as a proportion of the total resolved numbers. At the second step, we assume that the working numbers for which residential landline status is unresolved are distributed the same way as the working numbers for which this status is resolved. These assumptions may be superior to those of the first approach to estimation, if in fact most of the true nonworking numbers are resolved. In this event, it may be inappropriate or less accurate to attribute to the unresolved cases the same proportions of residential landlines, cell phones, business/nonresidential phones, and nonworking lines as found among the resolved cases, which is the assumption underlying the first approach.
Results for this second approach appear in Table 3, where the column labels build on those in Table 2. First, we classified the released telephone numbers as working, non-working, or working status undetermined (columns M-O). Numbers for which working status was not determined were those that received all ring-no-answer call outcomes, received all busy signal call outcomes, or received a mix of ring-no-answer, busy, disconnect, fast-busy, and fax/modem call outcomes but did not qualify as non-working. The working number rates are shown in column Q, with about 46.0 percent working numbers in the 1+ Listed 100-Banks stratum and with rates in the other three strata varying from 18.7 percent to 27.6 percent. Second, we classified the working numbers as residential landlines, cell phones, business/nonresidental, or residential landline status not determined (column R). Of the working numbers whose residential landline status was determined, the proportion classified as a residential landline was about 61.7 percent in the 1+ Listed 100-Bank stratum and <6 percent in each of the other three strata. Applying the observed working number rate and the observed conditional residential landline rate to the universe of telephone numbers yields the estimated number of residential landlines (column V), which we then convert into the estimated number of landline households (column W). We give the distribution of the landline households across strata in column X, which shows that the 1+ Listed 100-Banks stratum is estimated to cover 91.8 percent of landline households. Thus, given this approach, the standard RDD sampling frame omits coverage of an estimated 8.2 percent of landline households. This approach estimates the total number of landline households to be about 88.0 million, which is much closer to the estimate of 86.2 million households derived from AHS and NHIS data.
Third Approach. In the first two approaches, if a respondent hung up during the introduction (HUDI) or refused to complete the interview, the residential landline status of the telephone number was considered to be unresolved. As an alternative, we instead treat such telephone numbers as resolved and distribute them between residential landlines and cell phones in line with the observed distribution of resolved telephone numbers between residential landlines and cell phones. By treating HUDIs and refusals in this way, we are essentially assuming that such telephone numbers are not businesses, but could be either residential landlines or cell phones. Table 4, whose column labels build on those from Tables 2 and 3, shows the results of this approach, treating the resolution of residential landline status as a one-stage process as in the first approach. Of the 212 HUDIs and refusals in the 0-Listed Exchanges stratum, for example, 133 were allocated to residential landlines and 79 were allocated to cell phones, leading to an estimated 1.8 percent working residential landline rate in that stratum after this allocation. The working residential landline rates in each stratum (column AB) are applied to the universe count in the stratum (column A) to obtain the estimated number of landlines (column AC), which in turn is converted into the estimated number of landlines households (column AD). Given this approach, we estimate that the 1+ Listed 100-Banks stratum covers about 86.4 percent of landline households . Note that this approach estimates the total number of landline households to be about 82.2 million, which is slightly low relative to the AHS/NHIS estimate.
Other Approaches. We combined elements of the second and third approaches, allocating HUDIs and refusals to residential landlines and cell phones while also treating the resolution of residential landline status as a two-stage process. Given this method, we estimate that the 1+ Listed 100-Banks stratum covers about 83.1 percent of landline households and that the estimated total number of landline households is about 115 million. Because the estimate of households is implausibly high, we conclude that this method is flawed.
In all of the forgoing approaches to estimation, we classified telephone numbers as non-working only after the occurrence of two consecutive disconnects, two consecutive fast-busys, or three consecutive fax/modem call outcomes. In order to measure how sensitive the results are to this method of classifying numbers as non-working, we also calculated what would have happened had we stopped dialing and classified these numbers as non-working after a single disconnect, fast-busy, or fax-modem call outcome. The estimated total number of landline households decreases somewhat, but the estimated distribution of residential landlines across the strata remains largely unchanged.
Summary
We find that the conventional 1+ Listed 100-Bank sampling frame omits an estimated 7 percent to 14 percent of landline households, depending on the estimation approach used. These estimates fall between the estimates of 5 percent and 20 percent reported by Boyle et al. and Fahimi et al., respectively. While we do not have a solid basis for favoring one of our estimation approaches over the others, we are generally most comfortable with Approach 2, which produced an estimate of 8.15 percent non-coverage.
Table 5 illustrates the estimated coverage of households given alternative hypothetical sampling frames. In addition to omitting landline numbers that are not in 1+ Listed 100-Banks, the sampling frame also omits cell-phone-only households, currently thought to comprise about 20 percent of the total population of households in America, and all non-telephone households, about 2 percent of the total population. Thus, the sampling frame currently covers an estimated 67 percent to 73 percent of the total population of households.
If the sampling frame would be expanded to 1+ Listed 1000-Banks, coverage of total households would increase to the 70 percent to 74 percent range. If it would be further expanded to include all exchanges containing at least one listed telephone number, coverage of total households would increase to the 75 percent to 77 percent range. Increased coverage, however, would come with a severe price: a lower working residential number rate; that is, a larger sample of telephone numbers would need to be fielded to identify the same number of households, leading to increased cost. Given Approach 1, the working residential number rate declines from 17.9 percent for the 1+ Listed 100-Bank sampling frame to 9.3 percent for the 1+Listed 1000 Bank sampling frame to 6.3 percent for the 1+Listed Exchange sampling frame to 4.9 percent for the sampling frame consisting of all landline numbers. The working residential number rates cited here are a function of the calling rules used in the study and should not be taken as a measure of the working residential number rates achievable in studies that use fewer or more call attempts, or a shorter or longer data-collection period.
We did not ask respondents for the number of landlines in the household, so the number of landlines per landline household must be assumed. While this assumption influences the estimate of the total number of landline households, it affects the distribution of landline households only to the extent that the number of landlines per landline household varies across the strata. Here we have assumed this rate is constant across strata, but the results are very robust to this assumption. For example, if we assume there is only 1 landline per landline household in the 1+ Listed 100-Bank stratum and we assume there are 1.1 landlines per landline households in the other three strata (assumptions which are clearly extreme), the estimate of the 1+ Listed 100-Bank stratum’s coverage of landline households becomes 93.9 percent, which is not very different from the estimate of 93.3 percent we get under the assumption that the number of landlines per landline household is constant across strata.