Survey researchers collect large quantities of numeric data from respondents. This data collection involves a wide range of information (i.e., age, feeling thermometers, weight, income) and levels of measurement (i.e., nominal, ordinal, interval, ratio). The graphical user interface (GUI) used by computer assisted telephone interviewing (CATI) and web-based surveys offers researchers several options for inputting this data. In particular, researchers must choose between three common options in entering numeric values: radio buttons (clicking), boxes with cursors (typing), and visual analog scales (dragging). Speed of data collection is an important dimension to such decisions because researchers are usually concerned with minimizing completion time in order to maximize sample size while controlling cost.
Moreover, response time of a survey item is an important indicator of how respondents are processing and interpreting the visual design of a survey (Christian, Parsons, and Dillman 2009). A long response time may indicate a complex question that requires a respondent to provide a more thoughtful answer, but it may also indicate an interface which requires more “cognitive processing” of the questionnaire (Christian, Parsons, and Dillman 2009, 397). We argue that even small increases in speed are valuable in the aggregate by helping reduce the length of a survey and reduce the effects of respondent “weariness” (Ganassali 2008). Consequently, this study addresses a simple question: Is it more efficient to click, type, or drag?
Despite the simplicity of the research question, best survey practices can be evasive to identify. While many interface design decisions may seem intuitive, the complexity of the total survey experience bars confident reliance on intuition alone. Consequently, we tested the speed of these techniques using data from two randomized experiments. Results indicate that clicking is the fastest entry method followed by typing a numeric value. In contrast, dragging is the slowest input method.
Survey Interfaces and Speed of Data Entry
Since the creation of GUI centric software in the 1980s, scholars have been interested in how users respond to visual interfaces that go beyond the traditional keyboard and how certain design practices may facilitate efficiency and communication. Early scholars found that many of the graphic, direct-manipulation interfaces were somewhat non-intuitive (Mehlenbacher 1993). Today, most digital interfaces are non-textual, and most users of digital devices quickly learn how to enter and extract information from these devices.
Nevertheless, some interfaces increase error or slow down the workflow of even expert users. Given that data entry is a universal task in modern society, fields ranging from e-commerce to medicine to opinion research have explored ways to improve how users interface with input devices (e.g., Chen, Hellerstein, and Parikh 2010; Couper, Tourangeau, and Kenyon 2004; Couper, Tourangeau, and Conrad 2007; Emde and Fuchs 2012; Khajouei and Jaspers 2008; Pauwels et al. 2009). Recognizing both the efficiency expectations of data entry professionals and the dangers of entering incorrect information, researchers in fields as diverse as medicine and computer science have explored the strengths and weaknesses of interface designs such as the use of pull down menus, auto-entry features, warning prompts, color variations, and screen layouts (Khajouei and Jaspers 2008).
In regard to our specific research question, whether it is faster to click, type, or drag, we offer these theoretical expectations. Analog or dragging interfaces provide the advantage of a user not switching from a mouse to a keyboard. We expect some of the consequent efficiency in dragging to be offset by the difficulty of placing the slider on the precise value. This expectation is consistent with Couper et al.'s (2006) finding regarding ordinal data in a web survey. However, efficiency may be increased in dragging interfaces by setting the survey item to a default value.
Typing loses the advantage of not switching between a keyboard and a mouse, but the computer user does not have to worry about properly aligning the slider with the observed value. Given that many interviewers are typically proficient with numeric entry via a keyboard, we expect typing to be faster than dragging. Clicking offers the best of both worlds: mouse-only entry with quick precision of entry. Consequently, we expect clicking to be the fastest of the three methods, especially when response options are aligned in a visually predictable order, such as from least to greatest.
Research Design
We tested the speed of entry of the three interfaces (click, type, and drag) through two randomized experiments embedded within a live-caller telephone survey of North Carolina voters. In August 2012, the Elon University Poll conducted the telephone survey using 40 computer terminals and WinCATI 5.0 software. The questionnaire was designed using Sensus 5.0. The survey data was collected by over 80 student interviewers who interfaced with the survey instrument, collecting approximately 800 responses over a 4-day period (www.elon.edu/elonpoll).
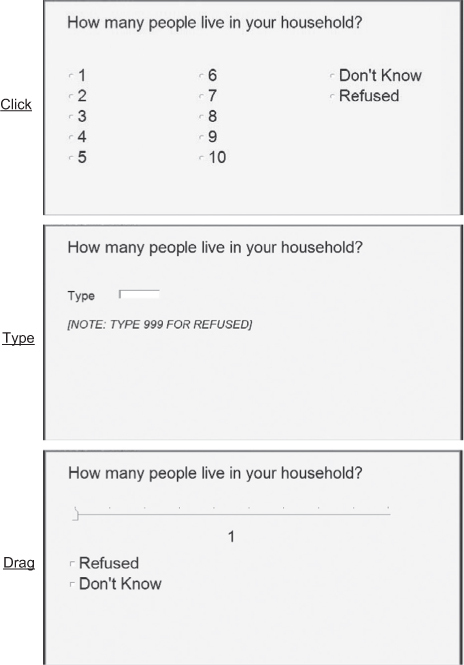
We embedded the first experiment into a survey item asking, “How many people live in your household?” The software randomly assigned a question to one of the three types of input interfaces (click, drag, or type). Figure 1 is a combination of partial screenshots of the household size question that demonstrate the three input types: click, type, or drag. The drag input option was set to the value of one (the expected modal value for responses). In addition, student interviewers had the option of clicking separate boxes for “don’t know” responses and refusals.

The second experiment centered on a question asking, “How old are you?” In this case, either a type or drag interface was randomly assigned to the question. (A click interface was not used because of the large range in possible age responses.) The drag interface was set to 40, the expected mean age of respondents. By replicating the experiments in a question with a long scale (age) and a question with a short scale (household size), results are more generalizable to the many varieties of survey questions associated with numeric data entry.
The total number of seconds taken to complete each question was recorded. This time measurement serves as the dependent variable in the following analysis. In order to account for outliers, we also present results for logged values of time. Randomization occurred across interviewers – any given interviewer in a given interview had a random chance of receiving any interface type.
Comparing Speed of Numeric Entry
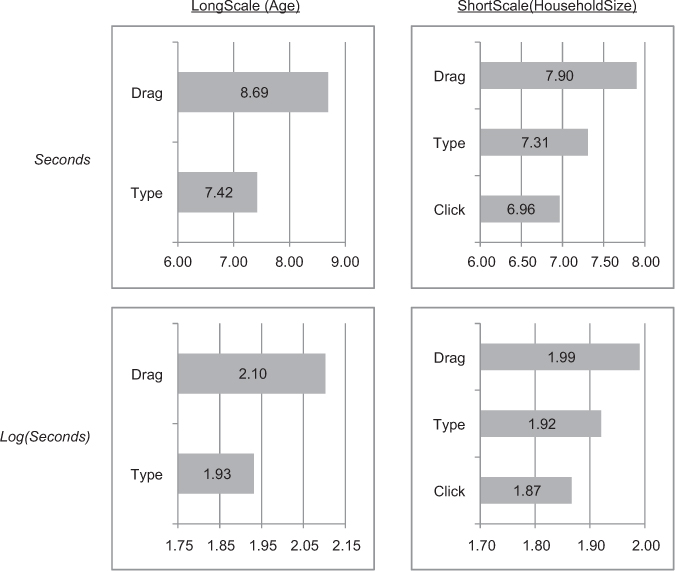
Figure 2 shows results of the experiments. The two bar charts in the left column present average times to complete the age question. The two bar charts in the right column present average times to complete the household size question. The upper charts report time in seconds. The lower charts reports time in logged seconds.[1] We evaluated the statistical significance of these differences with independent sample t-tests. Table 1 presents results of those t-tests.
Contrary to perceptions by some advocates of “keyboard-less” interviews, analog sliders actually increase the total time of survey completion. The short scale question took an average of 7.9 seconds to complete when interviewers used the slider. This was 0.592 seconds longer than the text box or typing interface (t = 2.02) and 0.935 seconds longer than the radio button or clicking interface (t = 3.096). Differences between dragging and clicking or typing were of similar significance when seconds were logged. On the long scale question about age, dragging took an average of 8.693 seconds while typing took 7.422 seconds. This 1.27 second difference is statistically significant (t = 6.622). Once again, differences between dragging was significantly slower than typing when seconds were logged (t = 8.561). Average time to complete was 12 percent faster for clicking over dragging. In a common survey with numerous numeric input questions, researchers might shorten total survey time by one to two minutes by avoiding analog sliders.[2]

While faster than the analog slider, typing was slower than clicking in the short scale experiment. However, the 0.343 second advantage of clicking over typing is not statistically significant (t = 1.215). Clicking was not presented as a treatment group in the long scale experiment due to the cumbersome nature of offering radio buttons for each potential age. Consequently, a long scale comparison between clicking and typing is not plausible.
One concern is that costs regarding inaccuracy would offset benefits regarding speed. We find little evidence to suggest that one technique is more or less accurate than is another, at least in CATI interviews. For instance, the mean of age in years was a statistically indistinct 0.3 years difference between dragging and typing groups (t = 0.276). Likewise, the standard deviations between these groups were virtually identical (F = 1.011). The short scale experiment produced similar accuracy results. We did not find nonresponse differences between the interfaces. We expect these accuracy results would be consistent in both perceptual and factual questions because our concerns about accuracy are mechanical rather than psychological.
Conclusion
Results offer several suggestions for best practices regarding numeric data entry in surveys. If speed of entry is the primary concern in designing an entry method, an ordered set of radio buttons is optimal. When the quantity of numeric options makes radio buttons implausible, researchers should choose a type box over an analog slider. However, researchers should weigh the advantages of speed to purported benefits of a “mouse-only” interview for the end-user experience. In a web survey, researchers might prefer the visual appearance of a slider over the efficiency advantages of radio buttons or text boxes. The interviewers were not informed about the experiment. However, the few interviewers who commented on differences in interfaces expressed clear opposition to dragging.
Because all interviewers for the Elon University Poll are students, few interviewers have substantial experience using computer survey interfaces. Though the student interviewers receive ample training prior to making calls, they are inexperienced in CATI software relative to professional interviewers at commercial call centers. This suggests that results are likely generalizable to web surveys as well, even though these experiments reflect response times within a CATI system.
While efficiency gains from input type selection are small, they are statistically significant. Over the course of a lengthy questionnaire, small gains accumulated by many questions could lead to substantively important improvements in speed and, subsequently, overall survey quality.
Questions that took over 30 seconds to complete are indicative of a technical problem unrelated to differences in data entry times. We omitted such cases from the analysis. This restriction applied to less than 2 percent of total cases.
We also employed a negative binomial regression to test whether interviewers became more efficient over time with a particular interface. The results showed the advantage typing had over dragging decreased as interviewers became more experienced, but typing still remained significantly faster. In contrast, we found the time advantage of clicking over dragging actually increased as interviewers completed more surveys. Overall, interviewer learning did not substantively change our findings or conclusions, suggesting that results are generalizable to professional interviewers.