In online surveys, running tallies or constant sums are used with number boxes to help respondents sum up amounts to exactly 100 percent, 24 hours, etc. The cumulative total is displayed on screen and updated as numbers are successively entered. This is a feature unique to online surveys. In this paper, we conduct an experiment with running tallies and focus on order effects. We hypothesize the order of response options could affect reported values. Specifically, we expect to observe primacy effects, with the first response option receiving larger values than response options that follow.
Experimental Design to Test for Primacy Effects
To test for primacy effects, we conducted a survey experiment with a sample of online adult panelists from KnowledgePanel® — the probability-based, online panel maintained by Knowledge Networks.
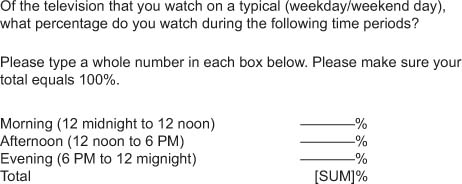
Data were collected in a survey fielded in August 2010 and completed by 2,098 panelists (representing a 66 percent completion rate). Respondents were asked to provide running tallies of the percentage of television they typically watch. All respondents were first asked about a typical weekday and then about a typical weekend day. Actual question wording is presented below, in Figure 1.

Most important for this experiment, the order of the three time periods was rotated, as show below, in Table 1. In Version 1 of the survey, the order of the response options was: morning, afternoon, evening. In Version 2, the order was: afternoon, evening, morning. In Version 3, the order presented was: evening, morning, afternoon. We decided to rotate the response options rather than randomize them since there are certain combinations (morning, evening, afternoon) that may appear peculiar to respondents. Across all versions of the survey, each time period has an equal (33.3%) chance of appearing in positions 1, 2, and 3.
Experimental Results
Observed percentages from the experiment are presented below, in Tables 2 and 3. In each table, percentages have been collapsed across versions of the survey.
In Table 2, percentages are displayed according to time period, regardless of whether that particular time period was presented first, second, or third.
For both weekdays and weekends, panelists report most TV watching is done in the evening. Distributions between weekdays and weekends are similar, although a higher percentage of television is viewed during weekend afternoons.
In Table 3, the results are reorganized. Percentages are displayed according to the order presented in the survey, regardless of time period.
We see percentages are highest for the time period presented first and lowest for the time period presented last. For example, during weekdays, respondents report watching 34.6% of television during the time period presented first (regardless of whether the time period is morning, afternoon, or evening). During weekdays, respondents report watching 32.3% of television during the time period presented third (again, regardless of which time period appears third). A similar pattern is found for reported television watching during the weekend.
Thus, primacy effects are detected, however differences by order are small and are not statistically significant. Percentages are close to 33.3%, which we would expect to observe in the absence of order effects.
Discussion
In this experimental work on running tallies and primacy effects, we find the first response option receives larger values than response options presented later. However, the observed primacy effects are small and do not attain statistical significance.
Because time spent watching TV is a regular activity, viewing patterns are likely to be encoded in memory and reported reliably, with responses less susceptible to order effects. Examining the raw data shows respondents report round numbers that easily sum to 100% (30%/30%/40%; 10%/20%/70%; 25%/25%/50%, etc.). It appears this was not a difficult cognitive task for respondents.
We conducted another running tally experiment on time use with 524 KnowledgePanel respondents in January 2011. Once again, differences in reported values by order were not statistically significant.
Running tallies are survey items unique to online surveys. However, not much research has been conducted on this type of item and we welcome additional research.