Public policy polls should be a boon in a governmental system where the people elect their representatives. But as numerous authors have pointed out [1], there are some serious problems with poll results that often make them less than useful.
This article is intended to stimulate discussion on the current problems with public policy polls, and to invite readers to submit essays for the December issue of Survey Practice addressing some aspect of these problems. Essays that defend current practices are just as welcome as articles that point to problems. Any suggested solutions to problems are welcome as well.
Perhaps it’s useful to focus the discussion on three major issues that various authors have identified that detract from the utility of polls: 1) ignoring non-opinion, 2) not accounting for intensity of opinion, and 3) failing to differentiate between hypothetical and actual opinion.
(If there are other issues a reader would like to address that deal with the current practices of public policy pollsters, these articles are acceptable as well.)
Ignoring Non-Opinion
In his long-running publication, Polling and the Public: What Every Citizen Should Know, Herbert Asher (2007) begins his analysis with a chapter devoted to “The Problem of Non-Attitudes.” He writes (p. 32):
“The presence of non-attitudes is one of the simplest yet most perplexing problems in public opinion polling. Too often in a survey context, people respond to questions about which they have no genuine attitudes or opinions. Even worse, the analyst or the poll’s sponsor or the news organization treats the non-attitude responses as if they represented actual public opinions.”
Most public policy polls employ forced-choice questions, which provide no explicit “no opinion” or “not sure” option. Sometimes, however, pollsters will include such options – though there appears to be no policy as to when non-opinion is acknowledged and when it is not.
Some questions related to this issue are: Should pollsters always attempt to assess the percentage of the public with non-attitudes? If not, what general guidelines should help determine when it’s appropriate and when it’s not appropriate to ignore non-attitudes? What are the consequences of ignoring non-attitudes?
Non-Accounting for Intensity of Opinion
Related to the issue of non-opinion is the issue of opinion intensity. As Asher notes above, often people will respond to a question about which they have no genuine attitude or opinion – even if given a “no opinion” option.
The earliest of modern day pollsters recognized this problem and argued for some way to address it. Daniel Katz wrote a chapter in a 1944 book by Hadley Cantril and Associates, Gauging Public Opinion, that “to interpret poll results adequately it is necessary to know whether an expressed attitude represents a superficially held view which may be discarded the next moment or whether it reflects a cherished conviction which will change only under unusual pressure.” He argued that it was crucial to determine “whether or not an individual with a given opinion holds that opinion strongly enough to take the trouble to go out and vote for it or fight for it.”
While philosophically it may be difficult to determine the cut-off point between a superficially held view and a cherished conviction, practically all pollsters have asked some version of this follow-up to an expressed policy preference: “Do you support/oppose that strongly or not strongly?”
Most polls, however, do not include such a measure of intensity. In part, I believe, that’s because most pollsters want to maximize the percentage of people with apparently “cherished convictions.” But in part, I believe, most pollsters and reporters simply don’t know what to do with the intensity measures. Even when they are included, the “strongly” and “not strongly” percentages are usually combined into one summed number, which is then reported as the percentage with that opinion.
There are other ways to measure intensity, such as how important is the issue to the person (on, say, a scale of 1 to 10), or whether the issue is so important the person would vote against a political candidate with a contrary view. Still, the summed percentage is typically used as the benchmark measure of opinion, despite the fact that it includes both the superficially and strongly held views.
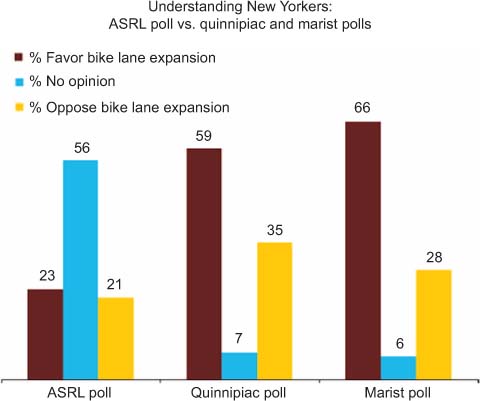
One alternative method to differentiate the superficial from the non-superficial was explored by my Gallup colleague, Jeff Jones, and me (Moore and Jones 2002), when we asked how upset people would be if the policy that was actually adopted was the opposite of what the person had just expressed. For example, I recently used that approach in an ASRL poll of New York City residents about the expansion of bicycle lanes.
People who favored the expansion were asked how upset they would be if there were no expansion of lanes, and people who opposed the expansion were asked how upset they were that the expansion was occurring. People who said they were “very” or “somewhat” upset were classified as “upset,” while people who said they were “not too” or “not at all” upset were classified as “not upset.”
The “upset/not upset” dichotomy was used as one way to differentiate between people with a “cherished conviction” and people with a “superficially held view which may be discarded the next moment.” In fact, for some people to say they opposed the expansion of bike lanes, but they are not upset that bike lanes are actually being expanded, did seem to fit Katz’s criterion of a view that was literally discarded the next moment after it was expressed.
Conceptually, it seems reasonable to say that a person who would not be upset whether a policy is – or is not – followed is a person who essentially doesn’t care one way or the other. By not caring, I mean a person who is so unengaged at that time that he or she is willing to go along with whatever the political leaders decide. Thus, he or she can be treated as someone with “no opinion.”
One question to be addressed is whether that approach to measuring opinion is a more realistic version of what the public is thinking than the typical approach using forced choice questions and not measuring intensity. Both Marist and Quinnipiac polled on the same issue, at roughly the same time (end of July, early August), using a forced-choice question (no explicit “no opinion” option) and no follow-up to measure intensity. The comparative results are shown in the following graph:
Clearly, there is a large difference in the picture of the public presented by the two different approaches. The ASRL poll suggests two approximately equal groups of supporters and opponents, with a majority of the public unengaged. The other two polls suggest a public that is overwhelmingly in favor of bike lanes, with only 6% to 7% of the public unengaged.
Is one version more realistic? What are the consequences of these two different pictures?
Hypothetical vs. Actual Opinion
Finally, there is the issue of pollsters feeding the public information, because the issue being polled is so arcane or complicated, most people simply don’t know enough about it to have an opinion.
Here’s an example of a poll question about the introduction of body scanning at airports:

“The Transportation Security Administration is increasing its use of so-called ‘full-body’ digital x-ray machines to screen passengers in airport security lines. Supporters say these machines improve the ability to spot hidden weapons and explosives, and reduce the need for physical searches. Opponents say these machines invade privacy by producing x-ray images of a passenger’s naked body that security officials can see, and don’t provide enough added security to justify this. Which comes closer to your own view? Do you support or oppose using these scanners in airport security lines?”
The results showed a 2-to-1 margin of support (64% to 32%) for the new policy, with just 4% unsure. This hardly seems a realistic picture of what people at that time actually thought. It’s most likely a reflection of respondents’ reaction to what ABC/WP told them (“supporters say…; opponents say…”).
At best, these results might be predictive of what the public would think if everyone was introduced to the arguments about the issue in the same exact way that ABC/WP presented them to their respondents. But, of course, other pollsters could introduce the issue in different ways, and thus produce contradictory results.
In any case, the ABC/WP poll results are clearly hypothetical. They don’t measure existing opinion, but at best potential opinion. Yet, pollsters typically do not alert readers to the hypothetical nature of the results. They treat the results of these information-fed polls the same as the results of polls that merely ask people what they are thinking without first priming them with select information.
Is this practice acceptable? Should pollsters and reporters make such differentiation, or doesn’t it matter?
See Asher (2007), Bishop (2005), Jacobs and Shapiro (2000), Moore (2008), Yankelovich (1991), and Zaller (1992), among others.