
Background
According to the National Center for Health Statistics’ National Health Interview Survey conducted between January and June, 2010, more than one in every four (26.6 percent) American homes has only cell phones and no landline phones. Nearly one in every six (15.9 percent) American homes has a landline yet receives all or almost all calls on cell phones. It was reported that Hispanic adults (34.7 percent) are more likely than non-Hispanic white adults (22.7 percent) or non-Hispanic black adults (28.5 percent) to live in cell phone only households.
Objectives
Given these and several other crucial survey findings from reputable sources, a study was designed by Encuesta, Inc. that explored related topics in order to assess:
- Do we really need to include a Hispanic targeted cell phone sample frame and cell phone only Hispanics sample when conducting surveys?
- Are cell phone only Hispanics different than other Hispanics or cell phone only non-Hispanics?
- Can exclusion of cell phone only Hispanics bias the survey results?
The study gathered a demographic profile and included a variety of topics such as healthcare, economic indicators, politics, and corporate responsibility.
Methodology
A nationally representative telephone survey was conducted with n=358 U.S. Hispanic and n=302 non-Hispanic (all other races and ethnicities in a representative mix) adults. Field/interviewing was between November 6 and 27, 2009. A proprietary random probability landline (random digit dialing [RDD] and listed Hispanic last name, n=443) and cell phone (RDD, n=217) frame sampling approach was used.
Interviews were conducted in English or Spanish, according to respondent preference. Of all interviews conducted among Hispanics, 56 percent were in Spanish and 44 percent were in English. Of the Hispanics interviewed, 46 percent were Spanish-Dominant, 39 percent were Bilingual, and 15 percent were English-Dominant according to the Encuesta, Inc. / Marin Acculturation Scale, a scale based on a series of questions that determine language usage in different situations.
The cumulative AAPOR RR3 for the household tier was: Hispanic .197, non-Hispanic .198, and cell phone tier .152. The cumulative AAPOR COOP3 for the household tier was: Hispanic .415, non-Hispanic .382, and cell phone tier .322. Overquotas were treated in the quota filled disposition as part of the calculations. No weighting was applied as a quota sample approach was employed, using for example age and gender distributions available from sources such as the Census and Pew Research Center. Different confidence levels are used for statistical testing to be able to maximize the ability to render differences especially in the case of small sample sizes.
Key Findings
Cell Phone Ownership
Cell phone ownership is higher among non-Hispanics compared to Hispanics. While 91 percent of non-Hispanics claim that they own a cell phone, 67 percent of Hispanics claim to own one.
Cell phone ownership is more common among younger Hispanics and non-Hispanics. While 69 percent of Hispanics who are under 55 years old say that they own a cell phone, 52 percent of Hispanics who are over 55 years old have a cell phone. Among non-Hispanics, 93 percent of those who are under 55 years old state that they own a cell phone versus 84 percent of those who are over 55 years old.
Cell Phone vs. Landline Phone
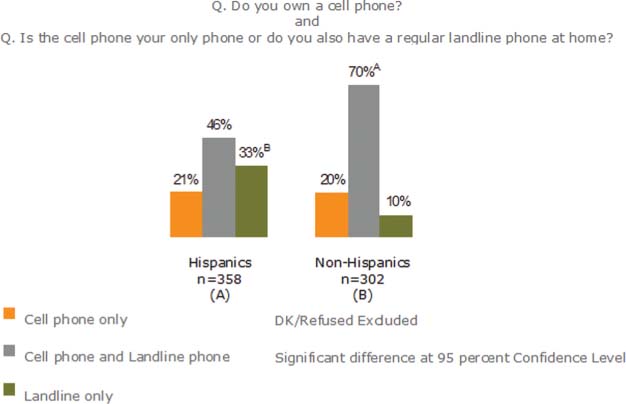
One in five Hispanics are cell phone only users, a proportion similar to non-Hispanics (Note: this study was originally conducted in 2009; this rate is climbing and now much more commonplace). A significant difference between Hispanics and non-Hispanics is evident in terms of landline phone ownership. While 33 percent of Hispanics only own a landline phone and do not have a cell phone, only 10 percent of non-Hispanics are landline only.

Hispanics who are between 18 and 34 years old are more likely to be cell phone only users than Hispanics who are 35 and older (32 percent versus 12 percent, respectively).
Cell Phone Only Hispanics versus the Rest of Hispanics and Cell Phone Only Non-Hispanics
Demographics
Striking differences exist between cell phone only Hispanics and the rest of Hispanics. Cell phone only Hispanics are more likely to be younger, U.S.-born, and single than the rest of Hispanics. Just like cell phone only Hispanics, cell phone only non-Hispanics are also more likely to be younger and single than the rest of non-Hispanics. Compared to cell phone only Hispanics, cell phone only non-Hispanics are significantly younger and more likely to be single.
Differences in socioeconomic status are also prevalent. Cell phone only Hispanics tend to have higher mean annual household income and more years of education compared to landline only Hispanics. Among non-Hispanics, cell phone only respondents are more likely to have more years of education than landline only respondents. Same is true for the comparison between cell phone only Hispanics and cell phone only non-Hispanics, even though cell phone only non-Hispanics have more years of education, the mean annual household income of cell phone only Hispanics and cell phone only non-Hispanics is similar.
Compared to cell phone only non-Hispanics, cell phone only Hispanics are more likely to be older, married, and live in an urban setting.
Attitudes and Behaviors
As part of the study, Hispanics and non-Hispanics were asked about corporate responsibility, economic indicators, politics, healthcare, and their activities on cell phone. In all of these topics, significant differences between cell phone only Hispanics and cell phone only non-Hispanics as well as differences between cell phone only Hispanics and the rest of Hispanics are observed.
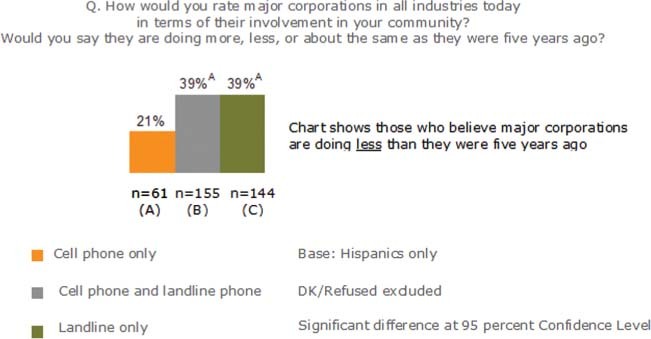
Cell phone only Hispanics are not only different demographically but also have distinct attitudes compared to the rest of Hispanics in several areas. One example is their attitudes in their views about corporate responsibility. Compared to the rest of Hispanics, cell phone only Hispanics are less likely to believe that major corporations in all industries are doing less than they were five years ago in terms of their involvement in the community (21 percent of cell phone only Hispanics think so versus 39 percent of Hispanic cell phone and landline phone users and 39 percent of landline only Hispanics). This difference does not exist among non-Hispanics, as 30 percent of cell phone only Hispanics think that major corporations are doing less than they were five years ago in their community compared to 33 percent of non-Hispanic cell phone and landline phone users and 29 percent of landline only non-Hispanics.
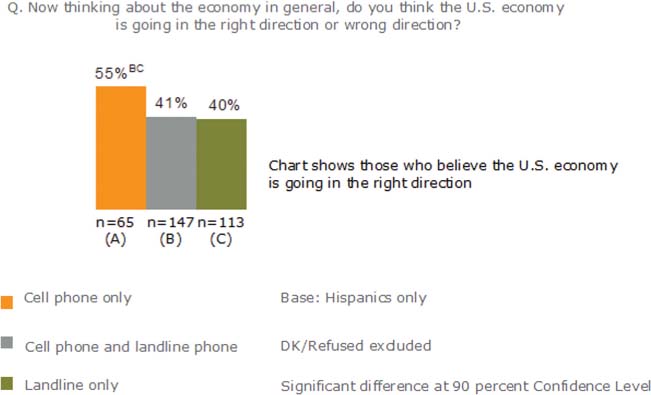
Another example where there are differences in attitudes is related to economic indicators. Cell phone only Hispanics are more optimistic than the rest of Hispanics with regards to the U.S. economy since they are more likely to think that the U.S. economy is going in the right direction. While 55 percent of cell phone only Hispanics believe that the U.S. economy is going in the right direction, 41 percent of Hispanic cell phone and landline phone users and 40 percent landline only Hispanics believe so. No significant difference is evident among cell phone only non-Hispanics and the rest of non-Hispanics in this regard. A total of 46 percent of cell phone only non-Hispanics think that the U.S. economy is going in the right direction compared to 42 percent of non-Hispanic cell phone and landline phone users and 38 percent of landline only non-Hispanics.

Another example was noted with regard to opinions related to healthcare. For example, compared to cell phone only non-Hispanics, cell phone only Hispanics are more likely to favor a requirement for all Americans to have health insurance with the government providing financial help for those who can’t afford it (79 percent of cell phone only non-Hispanics compared to 91 percent of cell phone only Hispanics), to favor a requirement for employers to pay into a government healthcare fund if the employers do not provide health insurance to their employees (81 percent of cell phone only non-Hispanics compared to 90 percent of cell phone only Hispanics), and to raise taxes on families with incomes of more than $350,000 as a way to pay for changes to the healthcare system (66 percent of cell phone only non-Hispanics versus 78 percent of cell phone only Hispanics). However, cell phone only Hispanics and cell phone only non-Hispanics have similar opinions in favoring a government health insurance plan to compete with private health insurance plans (73 percent versus 69 percent, respectively), requiring insurance companies to sell health coverage to people, even if they have pre-existing medical conditions (93 percent versus 90 percent), and limits on the amount of money that patients can collect in medical malpractice lawsuits (61 percent versus 53 percent).
Cell phone only Hispanics also have distinct political views compared to cell phone only non-Hispanics. They are less likely to be conservative and more likely to be moderate.
There are variations in the extent of cell phone usage for some activities, too. One activity where there are differences is recording video clips. Cell phone only Hispanics are more prone to recording video clips with their cell phones than cell phone only non-Hispanics (49 percent compared to 37 percent, respectively).
Special Topic: Acculturation
Demographics
Generally speaking and according to this study, compared to acculturated Hispanics (Bilingual and English-Dominant combined), Spanish-Dominants are more likely to be older, married, foreign-born, with less mean years of education and annual household income. The proportion of acculturated Hispanics and Spanish-Dominant Hispanics who have children in household under 18 years old is comparable.
Cell Phone Ownership
Acculturated Hispanics are more likely to own a cell phone compared to Spanish-Dominant Hispanics (81 percent compared to 49 percent, respectively). Compared to Spanish-Dominant Hispanics, acculturated Hispanics are more likely to only have a cell phone (13 percent compared to 27 percent, respectively).
Attitudes and Behaviors
With respect to corporate responsibility, Spanish-Dominant Hispanics and acculturated Hispanics have similar points of view. While 38 percent of Spanish-Dominant Hispanics say that the major corporations in all industries today are doing less than they were five years ago in terms of their involvement in their community, a comparable portion, 33 percent, of acculturated Hispanics think the same.
Compared to Spanish-Dominant Hispanics, acculturated Hispanics seem to have differences in their views regarding some of the proposals that were considered to address healthcare. Acculturated Hispanics are significantly less likely than Spanish-Dominant Hispanics to favor a government health insurance plan to compete with private health insurance plans (72 percent compared to 88 percent, respectively), requiring employers to pay into a government healthcare fund if they do not provide health insurance to their employees (85 percent versus 95 percent), and limiting the amount of money that patients can collect in medical malpractice lawsuits (62 percent versus 75 percent). In some other proposals regarding healthcare, though, the proportion of Spanish-Dominants and acculturated Hispanics who favor the proposal is similar; such as requiring all Americans to have health insurance with the government providing financial help for those who can’t afford it (95 percent of Spanish-Dominants versus 91 percent of acculturated Hispanics), requiring insurance companies to sell health coverage to people, even if they have pre-existing medical conditions (95 percent compared to 94 percent), and raising taxes on families with incomes of more than $350,000 as a way to pay for changes to the healthcare system (78 percent compared to 75 percent).
Acculturated Hispanics are more optimistic about the state of the U.S. economy than Spanish-Dominant Hispanics. While 49 percent of acculturated Hispanics think the U.S. economy is going in the right direction, 37 percent of Spanish-Dominants think so. When it comes to political views, no significant differences between Spanish-Dominant Hispanics and acculturated Hispanics are noted.
Acculturated Hispanics seem to be more likely to use their cell phone for several activities compared to Spanish-Dominant Hispanics. With their cell phone, they take pictures, record video clips, play music or MP3s, record video clips, play games, use the Internet, send or receive text messages and e-mail, use mobile maps for driving directions, and watch video or TV programs more than Spanish-Dominant Hispanics.
Conclusions
The findings indicate that excluding the cell phone only Hispanics when conducting research may introduce noncoverage error. A significant proportion of Hispanics are cell phone only with substantial demographic differences compared to the rest of Hispanics, especially landline only Hispanics, as well as to the cell phone only non-Hispanics. Leaving out this important population group may skew research results.
A weighting adjustment related to the cell phone only Hispanics’ unique demographics may not be enough to overcome noncoverage error. This population group is different not only in terms of demographics but also socioeconomics, acculturation, as well as attitudes and behaviors related to healthcare, political views, corporate responsibility, and adoption of technology. Hence, weighting practices relying on only demographics may not resolve the issue of bias on survey findings resulting from the exclusion of cell phone only Hispanics. The fast growing phenomenon among U.S. Hispanics in recent years and into the foreseen future must be addressed. Furthermore, if a propensity score weighting method is to be applied, then the knowledge base and survey source must be robust.