
Introduction
Within web survey design, the use of HTML (check-all-that-apply) boxes as opposed to radio buttons allows respondents to select multiple answers to one question. For such multiple response questions, research suggests that respondents select the response options differently (e.g., Christian and Dillman 2004). For example, while vertically listed response options seem likely to be selected from top to bottom, multiple column listing of response options coupled with the landscape orientation of computer screens may encourage respondents to select horizontally. Inspecting the sequence of response selection may shed valuable light on the ways in which respondents answer multiple response questions.
Knowledge of such behavior may be more important now than ever before. Recent research has shown that nearly 20 percent of mobile phone users do the vast majority of their web browsing on a smartphone as opposed to a computer or tablet (Miller, Purcell, and Rosenstiel 2012). This percentage is likely to increase as smartphone ownership has now surpassed basic cell phone ownership. Designing multiple response questions for web surveys that require very little space yet do not require scrolling, which can be cumbersome on a phone, makes the use of horizontally arrayed response options attractive. However, if people select options horizontally, instead of vertically, the distribution of answers may be affected. Thus, in this paper, we ask whether the orientation of a multiple response question affects the sequence of response selection and, if so, does this have an effect on the substantive distributions?
Background: Vertical vs. Horizontal Orientations
Historically, research has shown that there are order effects in the selection of check-all-that-apply items when a vertical listing of all items is provided. In short, studies show that early items are more likely to be selected (i.e., satisficing occurs) (Krosnick and Alwin 1987) and the mean number of items selected changes based on the order of the listed response options (Stern 2008). The web-based solution to this issue has been to use a forced-choice format in multiple response questions, employing radio buttons and an affirmative and negative response (e.g., “yes” or “no”, “used” or “not used”) for each option in the list (Smyth et al. 2006). Doing so seems to increase affirmative responses and reduce satisficing behaviors.
Because a landscape orientation works well in many web and smartphone screens, there could be an inclination to place the response options in multiple columns. Placing response options in two columns is commonly referred to as “double banking” and similarly placing response categories in three columns is called “triple banking” (Couper 2008; Dillman, Tortora, and Bowker 1998; Healey, Macpherson, and Kuijten 2005). If this is done, it may possibly change the order in which respondents select items. A related study has found that when linear scalar items are double or triple banked instead of being listed in a single vertical linear fashion, the response distributions changed in a way that suggested that some respondents were selecting horizontally rather than vertically (Christian and Dillman 2004). However, other studies have found that banking has little effect on overall substantive responses (Healey, Macpherson, and Kuijten 2005). As a result, we question whether the order effects are likely to exist when a different visual layout is used in multiple response questions.
We may be able to gain insight into whether a triple banking of categories where the response options are triple banked and horizontally orientated, affects the order in which responses are selected. As such, we may gain insight into whether a different response distribution occurs for those who select responses in a horizontal fashion, something that should be considered in designing for smartphone applicability and ease.
Experiment
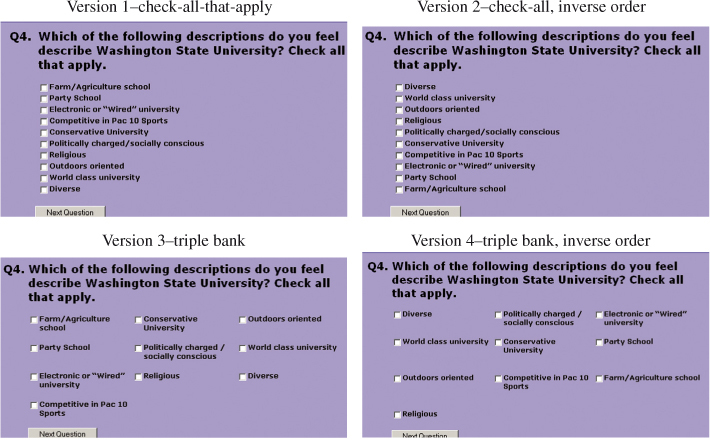
The experiment used in this study was embedded in a 21-question student satisfaction web survey distributed to a random sample of 3,004 Washington State University undergraduate students. Four versions of the questionnaire were constructed and randomly distributed to the respondents upon entrance to the web survey. There were two versions of the vertical layout and two versions of the horizontal layout of a check-all-that-apply question (see Figure 1) with ten response options. (Both the vertical and horizontal layout had a reverse order version making four versions all together.) The question appeared on its own screen with black text against a light blue background. White HTML check boxes were provided to offer a contrast between the background and the answer space.
Based on cognitive interviews[1], it appeared that most respondents selected in a top-to-bottom (linear) way regardless of whether the response options were banked or listed vertically. Using paradata (addressed below), we analyzed whether respondents selected responses in either a linear sequence or a nonlinear sequence. A linear sequence indicated that each subsequent answer was later in the list than the previous answer. That is, respondents selected from top-to-bottom and then left to right in the triple banked versions. A nonlinear sequence indicates that the respondent’s second or third answer appeared before his or her first or second answer in the list (i.e., they skipped around).
The paradata string received in the data included the respondent’s identification number, the version of the survey, the operating system the respondent was using, the time of day the respondent completed the survey, the time taken between each keystroke, and the sequence in which responses were selected. Below is an example of paradata from the multiple response questions. Each possible response is assigned its own letter for coding. Thus, this respondent marked 14o and 14f. The time is recorded in milliseconds therefore the time between entering the screen and providing the first response was t=13168 or about 13 seconds, and the time before the second response was t=21080 or about 21 seconds.
Example of multiple response question:
Microsoft Internet Explorer version 4.0 (compatible; MSIE 6.0; Windows NT 5.1; .NET CLR 1.0.3705),Tue Mar 11 21:48:06 PST 2003,t=13168:Q14o=1, t=21080:Q14f=1
As is common in time analyses, the outliers of two standard deviations above the mean time were removed (Bassili and Fletcher 1991; Heerwegh 2003). The reason for removing the outliers is that these extreme values may be the result of something very different from question orientation or wording such as multitasking. In this paper, we are interested in burden estimation as well as substantive responses in horizontal or vertical arrayed check-all-that-apply orientations. In all, we excised 19 cases for which we have paradata because they either consisted of respondents who provided none or only one response to the question or had time stamps that were two standard deviations above the mean.
There were 1,591 completed surveys producing a response rate of 53 percent.[2] The response by treatment was as follows: Version 1 was 27.3 percent of the total with a 58 percent response within treatment; Version 2 was 27.5 percent of the total with 58 percent response within treatment.
Version 3 was 23.1 percent of total with 49 percent response within treatment; Version 4 was 22.1 percent of total with 47 percent response within treatment.
Results
The lowest mean number of answers selected for any of the four versions was 3.85. Therefore, we analyzed sequences for the first two and first three answers only, as analyzing any number of answers selected above the mean would lead to the systematic exclusion of a large portion of the sample. As seen in Table 1, based on the percentage differences, we find that respondents who received the horizontal versions were more likely to answer the question in a nonlinear sequence in both the first two and first three responses. The differences between groups is statistically significant (two responses X2=23.656, p<0.001; three responses X2=11.105, p=0.011). Interestingly, despite the differences in selection, paradata analysis revealed no significant difference in the time spent or changes made across the versions. That is, there does not appear to be greater burden associated with one form of selecting or another.
We examined the response distributions for the individuals who selected at least three answers and dichotomized the groups by those who selected linearly and those who did not, regardless of question version (Table 2). There was little difference between the groups in terms of response distributions with exception of two items (“diverse” and “outdoors orientated”); both of which reached statistical significance at the p<0.05 level. In both the horizontal and vertical layouts, “diverse” appeared first in the list in two of the versions and last in the list in the other two versions.
The within group percentages indicate that respondents who selected in a nonlinear sequence regardless of version were more likely to choose “diverse” than the group who selected in a linear fashion. In both the horizontal and vertical layouts, “outdoors oriented” appeared eighth in the list in two versions and third in the list in the other two versions. The within group percentages indicate that individuals who selected in a linear sequence were more likely to choose this option. A reason for this could be that in the horizontal versions where more non-linear selecting occurred, “outdoors orientated” appears in the upper right hand corner in one version (outside the foveal view) and in the lower left hand corner in the other. It is plausible that it was simply not seen as often in the horizontal versions; however, that does not explain why other response options also outside the foveal view showed no effects.
Conclusions
In this research note, we examined whether the orientation of a multiple response question affects the sequence of selection and whether this has a substantive effect on response distributions. This issue is a timely one as survey researchers grapple with ways to design questions that will translate to mobile devices. This study provides three important insights, which must all be viewed in concert.
First, when we horizontally array response options, respondents tend to select them in a different sequence. Second, selecting in a nonlinear fashion does not necessarily mean that the substantive responses will be dramatically different with the exception of some, perhaps, limited responses outside of the foveal view. This finding leads to questions about whether this investigation has relevance to the literature on primacy. Third, there is no evidence here that selecting in a non-linear fashion is more burdensome as measured in the time it takes to answer the question or the changes made in responses.
We must discuss several limitations to this work. First, there are very few replications here; thus, the generalizability of the results can be questioned. Second, we assume that English is the native language of the respondents and that they are therefore prone to read from right to left. Although it may seem safe to make this assumption for a study with a sample of undergraduate students from a large American land-grant university, we did not verify the respondents’ backgrounds. Understandably, linear and nonlinear selection is based on culture. Finally, given the specific goals of this paper and the brevity of the piece, we did not present many of the more complex analyses and comparisons. This was not the goal of this short article.
The limitations notwithstanding, this study suggests that researchers can consider the use of double-banked and, perhaps, triple-banked options when they know that respondents will be using smartphones and other devices where a landscape orientation is featured. The use of forced-choice orientations and long vertical lists are simply not palatable on smartphone screens; yet, they are still preferable on computers and tablets for reasons outlined above. Obviously, we still have a lot to learn about designing across mediums and our conclusions are based on one experiment. However, despite the limited data we provide here, we hope that this is one small step in that direction and future research builds on this note.
Cognitive interviews were conducted before the administration of the survey to the sample. The results are not included in this paper.
The response rate reported for this study is American Association for Public Opinion Research (AAPOR) response rate 2 (AAPOR 2004).