Three recent experiments demonstrate the efficacy of using mail contacts to convince address-based samples of general public households to respond to a Web survey (Smyth et al. 2010; Messer and Dillman 2011). Results show that mailing the Web request first to respondents, followed by a paper questionnaire at a later date, produced Web responses from over 1/3 of sampled respondents; the paper follow-up resulted in an additional 14-18%. This “Web+mail” design also obtained demographically dissimilar respondents via each mode: Web respondents were significantly younger with higher levels of income and education than mail respondents. Thus, it seems beneficial to offer mail as an alternative to Web to increase response rates and enhance the representativeness of respondents. However, as research suggests, it could also be the case that the mail obtains higher item nonresponse compared to Web, which raises concerns about the additional value mail might add in this type of Web+mail mixed mode design.
In this paper, we examine some of the determinants of item nonresponse for the Web and mail groups used in the three experiments reported in Smyth et al. (2010) and Messer and Dillman (2011). The experiments employ similar Web and mail combination strategies, questionnaire designs, and respondent demographic measures, making it possible to examine trends within and across the studies. Specifically, we report how survey mode, respondent demographics (e.g., gender, age, education, and income), and question format (e.g., close- and open-end) and type (e.g., attitudinal and factual) contribute to item nonresponse rates[1].
Methods
In the three experiments, sampled households were obtained via the USPS Delivery Sequence File and were sent four mail contacts over the course of about three months. The experiments employed multiple Web+mail and mail-only[2] groups to test the effects of mode sequence, cash incentives, Web instructions, and Priority Mail on response rates. In Web+mail treatment groups, we offered a Web request first to respondents, followed later by a mail alternative for those who did not respond initially via Web. In mail-only treatment groups, we offered only mail surveys throughout the data collection period. In this study, we combined data from all three experiments into one larger dataset. For example, the Web+mail mode reflects respondents from all Web+mail treatment groups across all three experiments. In addition, all experiments utilized a unified-mode design that provided quite similar visual layouts for Web and mail questionnaires and allowed respondents to skip questions without providing a response in both the Web and mail questionnaires (Dillman, Smyth, and Christian 2009).
Experiment 1, the 2007 Lewiston and Clarkston Quality of Life Survey (LCS), was conducted in a rural region in the Pacific Northwest (Smyth et al. 2010). Experiments 2 & 3, the 2008 Washington Community Survey (WCS) & the 2009 Washington Economic Survey (WES), were state-wide surveys of Washington households (Messer and Dillman 2011). The samples for Experiments 2 & 3 were stratified by urban and rural county, and post-stratification weights have been applied in analyses, as described in more detail in Messer and Dillman (2011).
Sample sizes and response rates for each experiment and survey mode are in Table 1. In all experiments, the mail-only treatment obtained the highest rates (vs. Web+mail) while the Web+mail design was successful at obtaining about two-thirds of responses via the Web. Furthermore, respondent demographics and questionnaire characteristics are mostly consistent across each of the three experiments (see Messer, Edwards, and Dillman 2012): Web respondents are younger and have higher levels of education and income compared to mail-only and mail follow-up respondents. Each of the questionnaires employed the same question formats and types, although the number of each format and type varies across the experiments.
Item nonresponse rates are calculated the same for mail and Web versions in each experiment. For each respondent, we divided the number of missing responses by the total number of possible complete responses and multiplied by 100. The total number of possible complete responses varied based on how respondents answered the branching questions, with the total number of items ranging between 92 and 110 (see Table 1). We calculated overall rates by averaging individual rates for a particular mode. Missing responses were indicated based on whether or not the respondent provided any answer on a particular item, with only unanswered items counting toward item nonresponse. Non-substantive (i.e., “don’t know” or “not sure”) or incorrect responses were considered to be responses in these analyses. Respondents who completed less than 50 percent of the items were dropped as “partial completes.”
Results
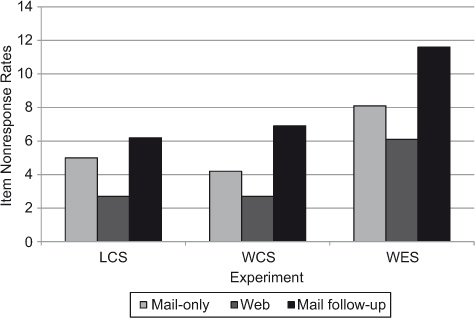
As shown in Table 1, item nonresponse rates were lower for the Web mode in each experiment (2.7-6.1 percent) compared to mail-only (4.2-8.1 percent), and the mail follow-up (6.2-11.6 percent). Item nonresponse rates are reported separately for mail used as a follow-up mode since respondents to this mode exhibit higher item nonresponse rates. Web item nonresponse rates are significantly lower than mail follow-up response rates across all three experiments at p 0.01 with the Bonferonni-Holm correction; for the WCS and the WES, the mail-only rates are significantly lower than those obtained via mail follow-up (for more detail see Messer, Edwards, and Dillman 2012). These differences are shown graphically in Figure 1 and the higher mail item nonresponse rates are likely a result of that mode obtaining respondents who are older with lower levels of education and income, which we test with multivariate analyses below. Also shown in Figure 1, when the Web and mail follow-up are combined, the total item nonresponse rates tend to be statistically similar to those obtained via mail-only (see Table 1).

Demographic Analyses
Table 2 displays the results of bivariate and multivariate Ordinary Least Squares (OLS) regression models predicting item nonresponse rates (i.e., dependent variable) by survey mode and individual demographic characteristics for each experiment. In Models 1, 3, and 5, we only included survey mode as a predictor of item nonresponse rates. These variables were all statistically significant at the 0.05 level or lower. In Models 2, 4, and 6, we included survey mode and controlled for demographic characteristics. Using global F-tests, we found these models to all be significant improvements over the models with only survey mode. Survey mode continues to be statistically significant (with one exception), even when controlling for demographic characteristics. On average, Web respondents tend to have significantly lower item nonresponse rates and mail follow-up respondents tend to have significantly higher item nonresponse rates than mail-only respondents, holding demographics constant. Demographic comparisons vary across the three experiments, but education and age tend to be consistent significant predictors of item nonresponse. With each additional year of age, the item nonresponse rate increases by about 0.10 units, holding other variables constant. Compared to respondents with a high school degree or less, respondents with at least some college tend to have lower item nonresponse rates, holding other variables constant.
Question Analyses
Table 3 displays results of OLS regression models predicting item nonresponse rates by survey mode and question characteristics for each experiment. We first conducted analyses with only survey mode as the predictor (Models 1, 3, & 5), and then ran models with question characteristics as controls. As before global F-tests indicate that our second models controlling for questionnaire characteristics (2, 4, & 6) are significant improvements over the models with only survey mode variables. In Models 2, 4, and 6, survey mode was statistically significant (with one exception), even when controlling for questionnaire characteristics. On average, Web respondents tend to have significantly lower item nonresponse rates and mail follow-up respondents tend to have significantly higher item nonresponse rates than mail-only respondents, holding questionnaire characteristics constant. In terms of questionnaire characteristics, the trends vary somewhat across the three experiments but some trends are consistent: screened, multi-item, and other factual questions tend to be significant predictors of item nonresponse across all three experiments in similar directions. Screened questions have higher item nonresponse rates than non-screened questions, even holding survey mode and other question characteristics constant. Similarly, multi-item questions have higher item nonresponse rates than single-item questions, controlling for other variables. Finally, other non-demographic factual questions have lower item nonresponse rates than demographic questions, holding other variables constant.
Conclusion
First, there appears to be a trade-off when using the Web+mail design. The mail follow up increases response rates and attracts different types of respondents but obtains lower data quality in terms of item nonresponse. In each of the three experiments, combining Web and mail follow-up respondents resulted in item nonresponse rates statistically similar to those obtained by using mail alone. Second, there may be demographic sources of item nonresponse, net of those resulting from differential participation in Web and mail modes. For example, even when controlling Web and mail mode of response, respondents who are older and have less education and income display higher rates of item nonresponse. Third, the results consistently show that question formats that require more effort than single-item, close-ended scale questions – branching, multi-item, and open-end questions – obtain higher rates of item nonresponse, net of mode of response.
It is likely that interactions between survey mode, demographics, and questionnaire characteristics contribute to variations in item nonresponse, but we are unable to conclusively determine if this is the case here. In addition, our studies are limited to regional and statewide samples from the Pacific Northwest and our measure of item nonresponse is made somewhat conservative by including all answers, whether invalid or not applicable, in the calculations and by setting the partial complete threshold at less than 50% of items answered.
Our overall conclusion from this analysis is that item nonresponse in a Web+mail survey design is not a major barrier to the use of this design for data collection.
Acknowledgments
Support for this research was provided by USDA-NASS and NSF-National Center for Science and Engineering Statistics, under a Cooperative Agreement to the Social and Economic Sciences Research Center (SESRC) at Washington State University. Additional support was provided by the SESRC.
A Technical Report by Messer, Edwards, and Dillman (2012) provides additional details on study procedures and analyses.
A “mail+Web” design was also employed but obtained so few Web respondents that we dropped them from analyses and refer to the design as “mail-only”.