


Introduction
Survey researchers are particularly interested in investigating methods of administering surveys and optimizing the rate at which people respond to them. In the past, surveys were administered using different methods such as telephone, postal mail (paper form), and face-to-face administration sessions. Although these methods are still in use, research illustrates that Web surveys are the predominant mode of administering surveys (COUPER, TRAUGOTT, and LAMIAS 2001; Dillman, Smyth, and Christian 2014). This trend is not surprising, as 40% of the world’s population and 88.1% of the population in the United States have access to the Internet today (internetlivestats.com). Web surveys provide researchers an opportunity to survey and gather data in an inclusive manner and from a global audience (Wyatt 2000).
Past research has shown that Web surveys tend to have several advantages over conventional surveying methods, such as shorter durations with regard to delivery of surveys, simplified data collection, and data entry. Researchers are able to explore a variety of survey design options by using Web survey software, such as Qualtrics or SurveyMonkey. They are no longer restricted to designs that are only conducive to paper-pencil formats (Couper 2000; Fricker and Schonlau 2002; Sheehan and McMillan 1999). Furthermore, recent research shows that Web surveys have an advantage over interviewer-administered surveys with regard to collecting sensitive data (e.g., sexual attitudes). Participants were more likely to report sensitive behaviors when surveyed through a Web survey than when surveyed through other survey methods (Burkill et al., n.d.).
Despite these advantages, Web surveys typically suffer from low response rates. A meta-analysis on survey response rates illustrated that Web survey response rates were 11% lower than response rates of other survey methods (Manfreda et al. 2008). Low response rates can be the Achilles’ heel of Web surveys, thereby adversely impacting the quality of the data they gather. Precisely, low Web survey response rates tend to compromise the power of statistical tests because researchers may not have enough participants in each condition to detect an effect. Furthermore, low response rates may reduce our confidence in the generalizability of results, as respondents may differ in important ways from those who do not respond. Hence, the effects we observe could be statistical artifacts (e.g., range restriction) and not true effects.
As ensuring an adequate response rate is an important element for maintaining the quality of the data gathered through Web surveys, this paper examines the efficiency of a particular strategy in enhancing Web survey response rates. Specifically, this paper investigates whether embedding the first survey question in the email invitation message increases response rates of Web surveys. To our knowledge there are only a couple of experimental studies that have examined this effect (Liu and Inchausti 2017; Vannette 2016). Both of these studies reported that having an embedded survey item in the email invitation increased the rates at which participants both started and completed the survey. Our study is a direct attempt to extend and replicate this finding.
Research shows that when an issue or event is salient to a population and when survey items remotely or directly tap into the salient issue or event, participants are more likely to respond to a survey (Sheehan and McMillan 1999). A salient event for one of our populations of interest, high school students, is taking the ACT test. A recent experimental study revealed that students who were either surveyed before or after ACT test day responded at a lower rate (15.3%–22.5%) than those who were surveyed on the day they took the ACT test. In other words, students were more likely to respond to Web surveys related to the ACT on a day that ACT was already salient to them rather than on days when ACT was not at the forefront of their minds (Moore 2016). Drawing from Liu and Inchausti’s (2017) findings, we postulated that embedding the first question of the survey within the email invitation would augment the response rates during time periods that are less salient to our population. In other words, we postulate that inserting an embedded question/item in the email invitation would act as an intervention that would alleviate the low response rates witnessed during less salient time periods.
Research questions
-
Does embedding the first survey question in an email invitation increase response rates for Web surveys?
-
Can having an embedded survey item in the email invitation boost response rates when students are surveyed during time periods that may be less salient?
Methods
An online survey was administered via Qualtrics to a disproportionate stratified random sample of students (N = 45,000) who had registered for the April 2016 ACT test. Students who self-reported as Asian, Hispanic, or African American were oversampled. White students, those students who chose two or more races, and those students who did not answer the race/ethnicity question were undersampled. All American Indian/Alaska Native and Native Hawaiian/Other Pacific Islander students were included. This sampling method was conducted to warrant a sufficient number of respondents in each racial group to conduct analysis for an applied research study. Students’ self-reported race was obtained from ACT’s database of students who registered for the ACT test.
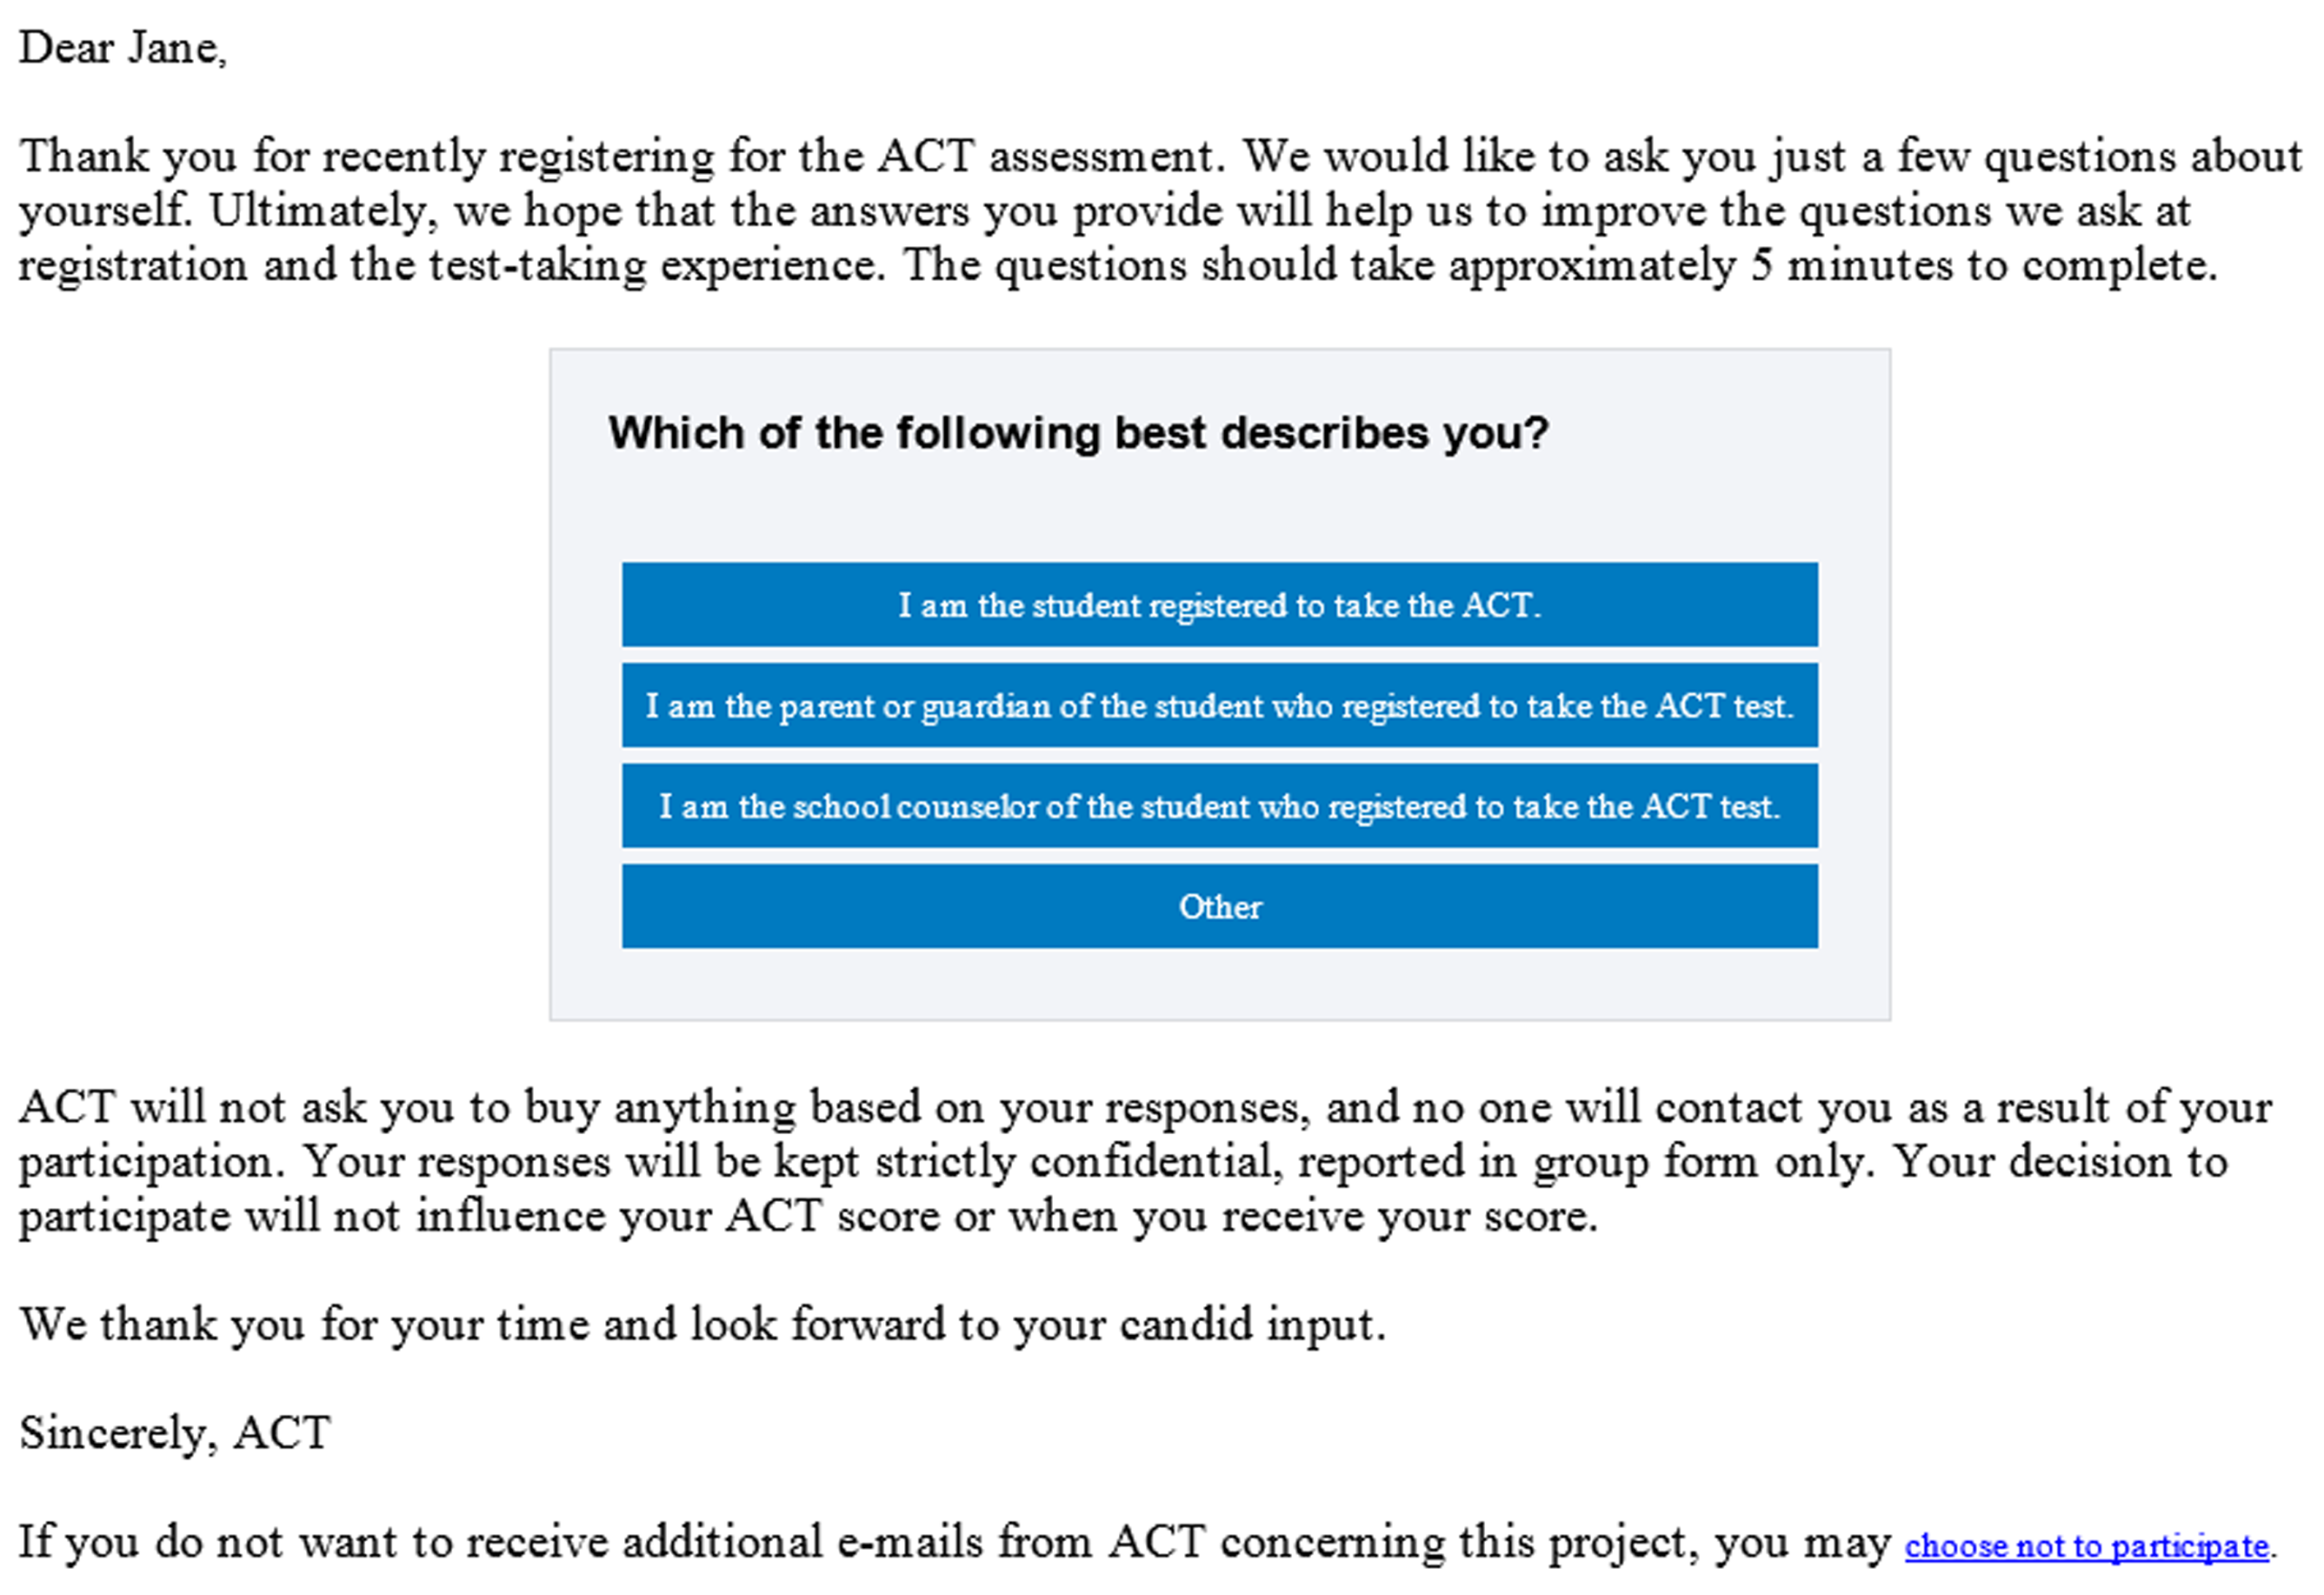
Students were randomly assigned to experimental groups using a 2 (invitation message) x 6 (the day the invitation was sent) research design. The invitation message included two condition groups: namely, invitation email with embedded item vs. traditional email invitation. In Condition 1, the email acknowledged that the student had recently registered to take the ACT test and asked him or her to participate in a Web survey. The invitation then asked students to start the survey by clicking on their answer to the first survey question (Figure 1). This is a filter question we ask at the beginning of each survey administered to students. Although most email addresses that are provided at the time of registration belong to students, occasionally a school counselor or parent will register a student for the test and inadvertently include their own contact information and not the student’s. Once participants clicked on the option that best represented them, they were redirected to the online survey, which already contained their answer to the first question. All participants who did not choose “I am a student registered to take the ACT” were exited from the survey.
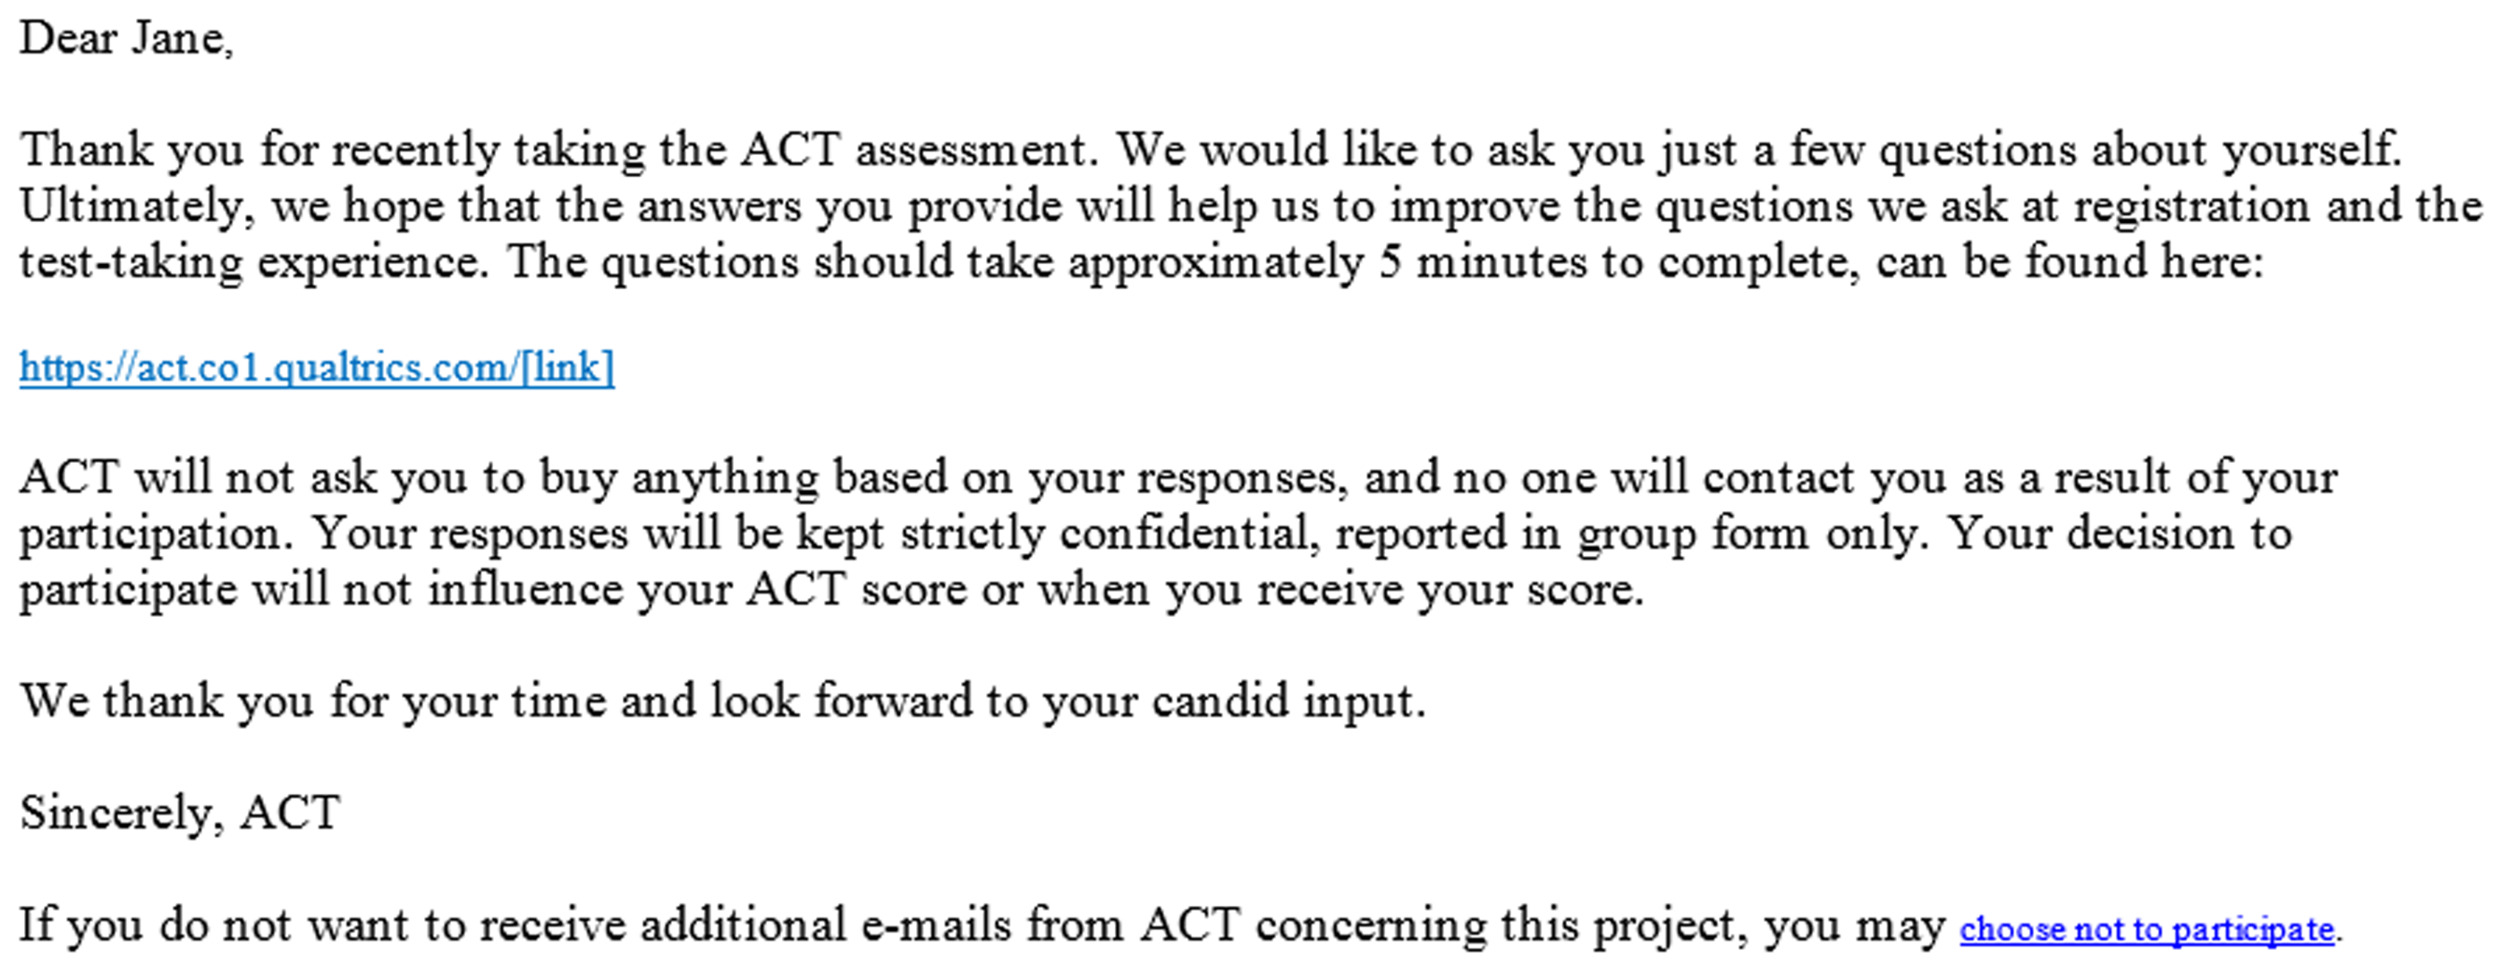
Participants who were randomly assigned to Condition 2 received the traditional email invitation. This message included the same short narrative acknowledging participants had recently registered for the test and it asked them to participate in a Web survey. However, the first question was not embedded in the invitation message. Instead, participants were asked to click on a URL customarily provided by Qualtrics (Figure 2). Once participants clicked on the link, they were redirected to the online survey.

Within each of these two conditions (embedded item invitation vs. traditional invitation), participants were randomly assigned to receive the invitation on different days (Table 1). Conditions were determined based on the distance in time from the most salient experience students had with ACT as an institution, which is the day students took the ACT test. However, all invitations were sent on a Saturday at 3:00 pm so as to control for the day of the week and time of day the invitation message was sent. This was done to determine if embedding the first survey item in the invitation had a differential impact on response rates, depending on when the invitation message was sent.
A reminder message was sent seven days after the initial invitation. It was identical to the initial invitation with the exception of a short sentence acknowledging that it was a friendly reminder to participate in the survey. The survey closed seven days after the reminder message was sent. All experimental groups were directed to the same Web survey. There were, however, two skip-logic patterns. The second survey item asked students to identify their race/ethnicity. If the student chose Hispanic, Asian, or Pacific Islander they were asked to indicate a more detailed racial category. Likewise, the subsequent items asked them to rank the top three languages most commonly spoken in the home. If a language other than English (ELL) was selected, five additional language questions were asked. All participants were asked to answer seven items about the type of school they attended.
Results
Our analyses involved two dependent variables, namely survey started/opened indicator and survey completion. The survey started/opened variable specifies whether a participant answered the first, embedded question or clicked on the survey link. We define survey completion as response to 80% or more of the survey. Table 2 summarizes the number of respondents based on these two dependent variables.
We also created two control variables that indicated whether some of the participants received additional survey items. Participants who either revealed that they spoke more than one language at home (e.g., ELL) or who identified themselves as Asian, Hispanic, or Pacific Islander received additional survey items. We controlled for these variables because one could argue that receiving additional survey items could impede completion rates. Hence, it was imperative to determine whether having an embedded survey item within the email invitation had a positive effect on completion rates despite controlling for the fact that some participants received additional survey items. Our independent variables were the invitation message condition participants were assigned to and the length of time between test day and the day they were surveyed (see Table 3).
In order to address the research questions, we carried out a series of logistic regressions. To answer our first research question, we regressed the started/opened indicator variable on the invitation variable while including the control variables in the model. The analysis revealed that the main effect of receiving an embedded survey item in the email invitation on starting/opening the survey was significant, b = 0.83, p <.001. Precisely, individuals who received the email invitation with the embedded survey item were 2.31 times more likely to start the survey than those who only received the traditional email invitation.
Similarly, to investigate whether embedding the first item in the email invitation increased the survey completion rate, we regressed the survey completion variable on the embedded item variable while controlling for whether additional ELL and/or country-of-origin items were presented. The logistic regression analysis revealed that this main effect was significant, b = 0.28, p <.001. Specifically, participants who received an embedded survey item in their email invitation were 1.33 times more likely to complete 80% or more of the survey as compared to those who did not receive an embedded survey item in their email invitation. As survey completion is of greater consequence than survey start rates from both business and research perspectives, the following analyses were carried out using survey completion as the outcome variable.
We were interested in examining whether being exposed to an embedded survey item in the email invitation would provide a boost in survey completion rate when participants are surveyed during time periods that are distant (a few weeks before or few weeks after) from the ACT test day. From past research within our organization (Moore 2016), we are aware that the response rate drops when we survey students before or after test day. Hence, we were interested in whether the presence of an embedded survey item would attenuate the negative relationship between less salient time periods and completion rate. To garner evidence for this research question, we created five dummy-coded variables. In each of these dummy-coded variables, participants who were surveyed on the day of the ACT test served as the reference group (Table 3). We also created five interaction terms—each of the time variables were multiplied separately with the embedded survey item variable.
The results revealed that all but one of the main effects of the time variable were not significant (Table 3). However, the results were in the expected direction. Participants who were surveyed at a time period that was before or after test day were less likely to complete 80% or more of the survey. Among the various interaction terms that were tested, only two of them were significant (Table 3). Precisely, the positive effect of having an embedded survey item in the email invitation on survey completion was 1.28 times higher for participants who were surveyed on test day than for participants who were surveyed five weeks before the test (Figure 3a). Similarly, the positive effect of having an embedded survey item on completion of the survey was 1.25 times higher for participants who were surveyed on test day than those who were surveyed two weeks before the test (Figure 3b).


Discussion
Survey response rate is considered a survey quality indicator by many researchers. Identifying optimal methods to increase survey response rates was one of the main objectives of this study. Our results are consistent with past research (Liu and Inchausti 2017); having an embedded survey item within the invitation message did indeed increase the likelihood of participants starting the survey and completing the majority of the survey. Many mechanisms could account for the positive effect the embedded question has on survey response rates. For instance, the embedded question could be a researcher’s way of getting his or her foot in the door and making a request to participants to answer at least one survey item. Past research shows that when individuals comply with an initial request they are more likely to comply with similar larger requests (Petrova, Cialdini, and Sills 2007). In this instance, participants who answered the embedded item may have wanted to appear consistent and thereby decided to comply with a similar larger request which is to complete the survey. Another plausible mechanism that could account for higher completion rates is that those who received an embedded item in their survey invitation encountered fewer hurdles to participate in the survey compared to those who had to click on an additional link to participate in the survey. This proposition has received some empirical support. Past research suggests that reducing the barriers towards survey participation results in enhanced survey completion rates (Vannette 2016).
In addition to replicating this finding, we examined whether having an embedded survey item within the invitation message would increase response rates during periods that are characterized by relatively low response rates. Our results suggest that having an embedded item within the email invitation does not improve the response rates when participants are surveyed during time periods that are not salient to them. Although we had hoped that an embedded survey item would mitigate low response rates during less salient time periods, participants who received an embedded item did not respond to the survey at a higher rate compared to those who did not receive the embedded item. Nonetheless, the study results reveal that if researchers would like to increase response rates during time periods that are salient to the participants, they should consider embedding the first survey item in their email invitations.
The results from this study suggest that although embedding a survey item within the invitation may increase response rates, such an increase may not be evident in circumstances where response rates are particularly low. For example, future research should examine whether embedding a survey item within the invitation can boost survey responses when the survey is long, rather than short, or when the survey is about a topic that is less interesting to participants, rather than more interesting.