Methods
This article reports on a trend study including three waves of data collection. In each wave, a diverse range of U.S. survey organizations reported on their recent dual frame random digit dial (DFRDD) surveys. The type of information that was gathered about the samples in these surveys included: (1) number of completions, (2) average length of a completion in minutes, (3) geography covered, (4) screening criteria, (5) completes per hour (CPH), (6) incentive amounts, (7) dialing methods for the landline interviewing,[1] and (7) the total count of sampled numbers actually attempted. From these data, we are able to estimate the cost per interview (CPI) associated with each sample.
The first wave was conducted during late 2009 by the Cost subcommittee of the second American Association for Public Opinion Research (AAPOR) telephone task force, to gather data from a select group of telephone survey organizations in the United States (Guterbock et al. 2010). This survey used a purposive nonprobability sample of eight nationally known survey organizations (four commercial and four academic),[2] providing production information for 38 separate DFRDD surveys.
The second wave of data collection was conducted by Guterbock, Peytchev and Rexrode (2013), using an online questionnaire that included more specific production details. They sent requests for participation to people in 98 survey organizations. This effort succeeded in gathering usable data on 37 dual frame surveys from 27 different organizations.
A third wave of data collection was undertaken in late 2015 for the AAPOR task force on the Future of General Population Telephone Survey Interviewing (Lavrakas et al. 2017). As in 2013, the primary sampling frame was based on a list of authors who had presented cell phone studies at the previous two AAPOR meetings, supplemented by the membership list of the Association of Academic Survey Research Organizations. The study team also obtained cooperation from two commercial survey sampling companies,[3] each of which circulated a survey invitation and a reminder letter to their clients who had recently purchased DFRDD samples. The 2015 survey gathered data on 53 dual frame studies conducted by 25 survey organizations, 11 of which were commercial firms.[4]
Altogether the surveys conducted in 2010, 2013, and 2015 provide CPH ratio data on 118 DFRDD studies, but since the detailed production statistics are lacking for the 2010 cohort of studies, as well as for firms that elected to provide only their CPH ratios, some of the results reported here rely on the 54 studies reported with full production details in 2013 and 2015.
Breaking Down Interviewing Costs
The per-interview cost of an RDD interview can be broken down into (1) the cost of interviewer time required to obtain a completion, (2) the cost of the sample numbers used to achieve that completion, (3) the cost of any incentives given to respondents, and (4) the cost of any mailings. By far the largest of these cost components is interviewer time. The main reason that cell phone interviews have historically cost more than landline interviews is because the former have required substantially more interviewer time to complete.
There are several factors that can affect the interviewing production rate, measured as Hours (of interviewer time) Per Completion (HPC = 1/CPH). These include the method of dialing used, the length of the interview, the number of dialing attempts devoted to each sampled phone number, and four independent properties of the telephone number sample and frame from which it is drawn: the working number rate, the contact rate, the eligibility rate, and the cooperation rate. (The product of these four rates is the sample yield—the ratio of the total number of completed interviews to the total number of sampled numbers attempted in the study.)
The interviewing cost per interview can be calculated as a product of the billing rate (or full cost) for an interviewer hour and the hours per completion (HPC). The HPC can, in turn, be thought of as a sum of the interview length and the hours spent (per completion) on screening and recruiting (i.e., all interviewer time that is not devoted directly to completing the interview).
It is this last cost component – screening and recruiting hours per completion (SRHPC) – that was found in the report of the AAPOR Cell Phone Task Force 2010 to be markedly higher for cell phone interviewing than for landline interviewing. Any differentials in productivity factors have a direct, multiplicative effect on the ratio of SRHPC in cell phone interviewing to SRHPC in landline interviewing. The SRHPC ratio (cell phone SRHPC divided by landline SRHPC) drives the HPC ratio and the overall cost ratio as well.
Changing Productivity Ratios
Table 1 shows how these rates have changed. The median SRHPC for cell phone samples dropped from 2.0 hours in the 2010 wave to 1.0 in the 2015 wave. Over the same period, the median SRHPC for landline samples went up from approximately three-quarters of an hour to a full hour. In general, the HPC rates are about one-third of an hour higher than the corresponding SRHPC rates (since the average interview was about 20 minutes long).
Table 2 shows how the SRHPC and HPC production ratios changed across the three survey waves.
The 2010 wave of data collection had a mean HPC ratio of 2.0 and a mean SRHPC ratio of 2.5. When the actual interview time is included in the numerator and denominator of the ratio, to yield the average HPC ratios seen in the table, the 2010 data showed that the HPC for cell phone calling was, on average, twice the HPC for landline calling. Just three years later, in the second wave of data collection, the average HPC ratio had decreased significantly to a mean of 1.5, and the SRHPC ratio had also decreased significantly, from an average of 2.5 to an average of 1.7. In the third and most recent wave of data collection, the HPC ratio went down slightly to a mean of 1.4, and the average SRHPC ratio also went down a little, to a new mean of 1.5. The decreases from 2013 to 2015 were not statistically significant.
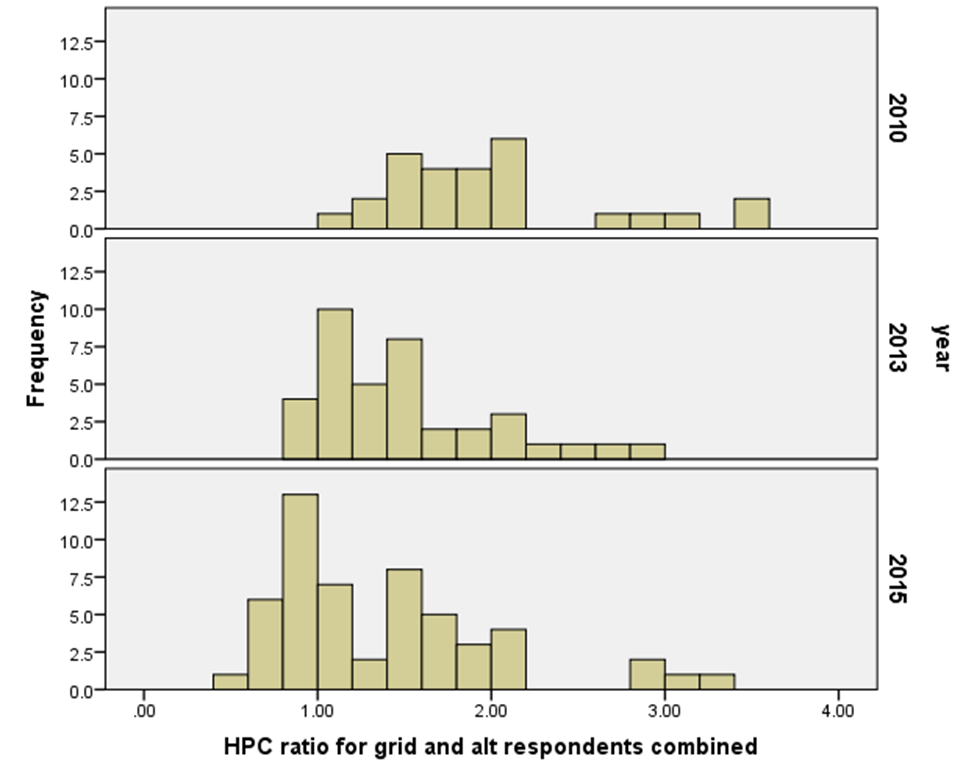
Figure 1 displays the distribution of HPC ratios in the three waves of data collection. The HPC values in 2013 were somewhat less dispersed than in 2010, and for the first time, a few surveys (four surveys in 2013) reported HPC ratios less than 1.00, meaning that the cell phone calling was actually more efficient than the landline calling. In the 2015 survey, the main group of HPC values moved further down, and 20 of the 53 reporting surveys showed HPC ratios below the parity level of 1.00.

Factors That Affect Productivity Ratios
The mean SRHPC ratio for the studies using predictive dialers for landlines was 2.1, while the mean was 1.2 for those using manual or interviewer-controlled dialing. While many of the studies using manual dialing recorded SRHPC ratios less than one, this was not the case for any of the studies using predictive dialing. A predictive dialing system moves some of the calling time “off the clock” of interviewer time, as the time of dialing and much of the time awaiting an answer elapses before the call is routed to an interviewer. However, a more detailed analysis that breaks down the SRHPC rates into separate dialing rates shows that predictively dialed landline samples have a significantly lower number of dialing attempts per phone number. On average, the organizations that dial their landlines without predictive dialers give more interviewer time to each call attempt, give more attempts to each number, and achieve higher landline yields at the cost of a higher HPC rate for the landline numbers (Guterbock et al. 2016).
The mean SRHPC ratio was 1.9 for surveys using a conventional cell phone sample compared to just 1.1 for an enhanced cell sample.[5] On average, surveys that used the enhanced samples experienced calling efficiency gains that brought cell phone interviewing efficiency to near parity with the landline efficiency.
To examine various factors that affect production ratios, we analyzed the data from survey organizations that reported detailed production data in either the second or third wave of data collection. We looked at five factors that might affect production rates: (1) whether landline predictive dialing was used; (2) the geography of the survey (national, statewide, or regional/local); (3) whether the study was a part of the Behavioral Risk Factor Surveillance System, which requires extended dialing for landlines; (4) whether cash incentives were offered to cell respondents, and (5) whether the cell phone sample was one of the newer “enhanced” types.
Table 3 shows the results of an Ordinary Least Squares regression analysis of the effects. By far the largest effect is from the use of a predictive dialer to call landlines. Surveys in which landlines are dialed with predictive technology have higher calling efficiency for landlines, thus raising the production ratios. The use of enhanced cell phone samples also has a strong effect, significantly lowering the production ratios because when these samples are used, cell phone efficiency is higher. Sample geography has a smaller but still significant effect, with lower production ratios in national samples as compared to state, local, or regional samples.
Our data indicate that the use of cash incentives for cell phone respondents has declined markedly. Seven years ago, about 4 out of 5 cell phone surveys offered cash to cell phone participants, contrasting with only about 1 in 10 in 2014/2015 (cf. Guterbock et al. 2012; Oldendick and Lambries 2011. There has also been a marked decrease in the use of ‘screened’ sampling designs that interview cell-only households and disqualify dual-phone households from the cell phone sample, a trend that has helped to lower cost ratios.
Overall Costs
Using the data from organizations that provided detailed production information, we can estimate average sample costs and interviewing-time costs from our 2013 and 2015 data. The averages reported in Table 4 must be interpreted with the knowledge that all the cost factors vary widely across specific studies and situations.
As can be seen in the top two rows of Table 4, cell phone interviews still cost more, on average, than landline interviews. Using representative cost figures for sample numbers and fixing the overall cost of an hour of interviewing time at $30, we arrive at estimated CPI rates of about $47 per cell phone completion compared to about $36 for a landline completion. Most of the difference in cost comes from the difference in HPC rates between the average cell phone sample and the average landline sample.
The third and fourth lines of Table 4 examine cell phone samples only, comparing the cost of a cell phone interview using a conventional sample versus enhanced sample. Although the enhanced samples are priced higher per number, the enhanced samples have much higher yields, so that the sample cost per interview comes out lower for the enhanced samples. On top of that, the enhanced sample produces a somewhat lower HPC rate, so that cell phone completions from enhanced samples cost about $45 versus $48 for those from conventional samples.
The last two lines of Table 4 focus only on landline calling and compare predictive dialing with manual or interviewer-controlled dialing. While predictive dialing surveys have a far lower yield and therefore cost more in terms of purchased sample per completion, the far lower HPC rate for predictive dialing more than makes up for this, so that the average completion using predictive dialing costs about $30 compared to $45 for manual dialing.
We estimate the average overall CPI for manually dialed landline interviews to be $44.71, while the average overall CPI for enhanced cell phone interviews is $44.74. If manual dialing of landlines becomes the norm, we may be arriving at a point where—literally—there will not be a dime’s worth of difference in average per-interview cost between landline and cell phone interviewing.
Looking Ahead
There are two trends that we can project with confidence into the near future. First, the trend toward allocating increasing shares of the total DFRDD sample to the cell phone side will continue. As more people abandon their landlines and adopt a cell phone-only or cell phone-mostly lifestyle, the cell phone frame becomes much more closely representative of the general population, while the landline frame continues to lose its ability to represent the population. In fact, some researchers are already making the case for using samples that are drawn 100% from the cell phone frame (Peytchev and Neely 2013).
A second predictable trend is that the use of enhanced samples for cell phones will become standard practice. Researchers who use cell samples that append activity information, or scrub out nonworking numbers, gain a significant cost advantage in the calling lab that outweighs the extra per-number cost of purchasing such samples (Dutwin and Malarek 2014).
Two cautions are in order with respect to the summary cost estimates provided in this report. First, the production rates for each frame depend in large part on respondent eligibility, so that some studies may experience very different cost ratios from the averages reported here. Second, DFRDD designs require weighting of the data, which increases standard errors due to the design effect. While this report has estimated overall costs and cost ratios for dual frame surveys, these estimates have been based on the actual number of completes, without taking design effects into account. The true cost of landline and cellphone interviewing would more properly be calculated in relation to the effective sample size, yielding an estimate of costs per effective completion (see Benford et al. 2009; Peytchev and Neely 2013).
Because the Telephone Consumer Protection Act prohibits auto-dialing of cell phone numbers, predictive dialing cannot legally be used for cell phone interviewing. Accordingly, our survey assumed that responding organizations used manual dialing for all cell phone interviewing that was reported for our study. Subsequent to our data collection, the federal guidelines were modified to allow autodialing of cell numbers in federally funded surveys.
The survey organizations were promised their names would not be disclosed.
Special thanks to Trent Buskirk, then at M-S-G, and Michel Durocher at ADSE Survey Sampler for their gracious assistance with our survey recruitment effort.
Organizations participating in the 2013 and/or 2015 waves of data collection are listed in the supplemental materials table, and the authors gratefully acknowledge their assistance.
Enhanced cell phone samples include samples with an activity flag appended, those with ZIP code information appended, those screened by “pinging” to determine if a number is working, and those drawing on proprietary databases of cell phone users with known demographic characteristics