
Introduction
Survey Modes Used in National Surveys for Monitoring Smoking-Related Behaviors and Attitudes
Population-based surveys such as Tobacco Use Supplement (TUS) to the Current Population Survey (CPS) are commonly used for monitoring smoking rules and public attitudes toward these rules in the United States (Agaku et al. 2014; Cartmell et al. 2011; Hitchman et al. 2010; Jarvie and Malone 2008; Brian A. King, Dube, and Homa 2013; Brian A. King et al. 2014; B.A. King, Patel, and Babb 2014; Brian A. King et al. 2016; Mills et al. 2011; Zhang et al. 2011; Zhang, Martinez-Donate, and Rhoads 2015; U.S. Department of Health and Human Services 2014). Some of these surveys (including the TUS-CPS) utilize mixed survey modes for reporting. For example, the TUS-CPS utilizes personal interviews and phone interviews. Because the survey mode may influence responses (Johnson and Mott 2001; Kreuter, Presser, and Tourangeau 2008; Sillett et al. 1978; Soulakova et al. 2009; Tourangeau, Rips, and Rasinski 2000; Velicer et al. 1992), the survey mode should be considered when estimating the prevalence of smoke-free homes and attitudes toward smoking restrictions. To the best of our knowledge, none of the studies which addressed home smoking rules and public attitudes toward smoking bans in the United States considered the potential effects of the survey mode.
The way the survey mode impacts responses is not trivial (Johnson and Mott 2001; Kreuter, Presser, and Tourangeau 2008; Sillett et al. 1978; Soulakova et al. 2009; Tourangeau, Rips, and Rasinski 2000; Velicer et al. 1992). For example, several studies examined the accuracy of reports associated with different survey modes. One such study estimated the prevalence of recanting, defined as an instance where a former or current smoker reports being a never smoker in the future (Soulakova and Crockett 2014). One of the results was that among current smokers interviewed by phone, the prevalence of recanting was significantly lower among self-respondents than among proxy-respondents; however, among current smokers interviewed in-person, the prevalence of recanting was similar for the self- and proxy-respondents (Soulakova and Crockett 2014). In another study, the prevalence of admitted illicit drug use and alcohol use was lower for phone interviews than for personal interviews (Aquilino 1994). However, in another study, the level of data accuracy for smoking abstinence duration reported by former smokers was higher for interviews conducted by phone both times than interviews conducted in-person both times and interviews conducted once in-person and once by phone (Soulakova and Bright 2015).
Several studies showed that depending on the measure, phone interviews can result in similar, higher, or lower estimates in comparison to personal interviews. For example, the survey mode was not significantly associated with reporting race, household size, level of education and immigration status, but it was significantly associated with reporting marital status, highest level of education in the household and several additional sociodemographic characteristics (St-Pierre and Béland 2004). Specifically, phone interviews were associated with the higher rate of reporting being single and being a home owner (St-Pierre and Béland 2004). In addition, phone interviews were associated with the lower rate of current smoking relative to the personal interviews (Soulakova et al. 2009). Moreover, the magnitude of the survey mode effect on responses could be different for diverse populations of respondents. Specifically, the discrepancy in smoking prevalence estimates for the two survey modes was higher among male and younger (18–24 year-olds) respondents in comparison to female and older (65+ year-olds) respondents, respectively (Soulakova et al. 2009). In addition, the impact of the survey mode on smoking prevalence was significantly different from 1992–1993 to 2003. These depicted trends suggested, potentially, the mode effect lessened from 1992–93 to 2003 (Soulakova et al. 2009).
The remainder of this section is outlined as follows: Section 1.2 briefly describes the goals and design of the TUS-CPS, data from which were used in the study; Section 1.3 summarizes prior research regarding home smoking rules and attitudes toward smoking rules in public places and in cars that used TUS-CPS and other national data sources; and Section 1.4 presents the study goals.
TUS-CPS
Since 1940, the U.S. Census Bureau has collected data on employment status in the United States using the CPS. The U.S. Bureau of Labor Statistics co-sponsors the CPS and uses the data for estimating employment and unemployment rates in the United States. For example, the data are used for reporting monthly rates and month-to-month changes in the State Employment and Unemployment Summaries (U.S. Department of Labor, U.S. Bureau of Labor Statistics 2017). The CPS uses a multistage sampling of households, where households from all 50 states and the District of Columbia are surveyed (“U.S. Department of Commerce, U.S. Census Bureau. 2017. Current Popoulation Survey. Methodology.” 2017). Each household is surveyed for four consecutive months (first phase), not surveyed for the next eight months, and then surveyed for four more consecutive months (second phase). To improve month-to-month continuity, a rotation strategy is imposed so that each month, one-eighth of the sample is surveyed for the first time, one-eighth of the sample is surveyed for the second time, and so on; this strategy was visualized using a figure (see Appendix 1 in J.N. Soulakova et al. 2009).
The TUS, one of the CPS’s supplemental surveys, is designed to obtain smoking-related information for 18+ year-old civilian, noninstitutionalized adults. The TUS has been administered every three to four years since 1992 (U.S. Department of Commerce and U.S. Census Bureau 2012). One survey period consists of three waves, e.g., the 2010–2011 TUS survey period includes May 2010, August 2010, and January 2011; the 2014–2015 period includes July 2014, January 2015, and May 2015. The interviews include personal visits (about 36%) and phone interviews (about 64%).
The TUS data have been used in many studies, including studies targeted to assess home smoking rules and attitudes toward smoking bans in public places and other venues (Agaku et al. 2014; Mills et al. 2011; Zhang et al. 2011, 2014; Zhang, Martinez-Donate, and Rhoads 2015). To our knowledge, however, the 2014–15 TUS data have not been used to estimate the rates of smoke-free homes and attitudes toward smoking bans.
Smoking Rules at Home and Attitudes Toward Smoking Bans in Public Places and Cars
National surveys are commonly used to monitor the rates of smoke-free homes and public attitudes toward smoking bans. This study explores the difference in the estimates corresponding to two survey modes—personal interviews and phone interviews—among single-parent households. Data from the Tobacco Use Supplement to the Current Population Survey administered in 2010–2011 and 2014–2015 were used in a stratified fashion. The rate of smoke-free homes was lower for personal interviews (79% in 2010–2011 and 82% in 2014–2015) than for phone interviews (85% in 2010–2011 and 90% in 2014–2015). Even after controlling for several factors, personal interviews corresponded to lower odds of having a smoke-free home relative to phone interviews (odds ratio [OR] = 0.7, confidence interval [CI] = 0.6–0.9, in 2010–11; OR = 0.5, CI = 0.4–0.6, in 2014–15). The survey mode should be included in the analyses when estimating the rates of smoke-free homes and other smoking-related attitudes, because different survey modes could be associated with different response biases.
In the United States, about 58 million nonsmokers are exposed to secondhand smoke each year (“Tobacco Use | Healthy People 2020” 2017): 41% of 3–11 year-olds, 34% of 12–17 year-olds, and 26% of 18+ year-olds (“National Health and Nutrition Examination Survey | Healthy People 2020” 2017). This exposure causes premature death and serious health problems, e.g., lung cancer, cardiovascular disease, head and neck cancer, and respiratory infections (McCarthy et al. 2012; Troy et al. 2013; U.S. Department of Health and Human Services 2006). The home is one of the main sites of secondhand smoke exposure (U.S. Department of Health and Human Services 2006; U.S. Department of Health and human services 2010). Public places such as bars, casinos, outdoor places, and cars are among the other sources of secondhand smoke exposure (U.S. Department of Health and Human Services 2006; U.S. Department of Health and human services 2010). Thus, smoking restrictions at home, in public places, and in cars play an important role in reducing the exposure to secondhand smoke (Agaku et al. 2014; Cartmell et al. 2011; Hitchman et al. 2010; Jarvie and Malone 2008; Brian A. King, Dube, and Homa 2013; B. A. King, Dube, and Tynan 2013; B.A. King, Patel, and Babb 2014; Brian A. King et al. 2014, 2016; Kruger et al. 2015; Mills et al. 2011; U.S. Department of Health and Human Services 2014; Zhang et al. 2011; Zhang, Martinez-Donate, and Rhoads 2015).
Among households with underage children (younger than 18 years old), the overall rate of smoke-free homes was about 84% in 2006–2007 (Zhang et al. 2011). Among households with underage children and at least one adult smoker, the overall rate of smoke-free homes was 50% in 2006–2007 (Mills et al. 2011) and 60% in 2010–2011 (Zhang, Martinez-Donate, and Rhoads 2015). Among these households, smoke-free homes were more common among households with younger compared to older parents, non-Hispanic White compared to non-Hispanic African American parents, two parents compared to a single parent, higher income compared to lower-income, higher-educated parents compared to lower-educated parents, and among households with infants compared to those without infants (Mills et al. 2011; Zhang, Martinez-Donate, and Rhoads 2015).
Factors associated with smoke-free homes were also associated with adult attitudes toward smoking bans in public places and inside cars (Agaku et al. 2014; Hitchman et al. 2010; Brian A. King, Dube, and Homa 2013; B. A. King, Dube, and Tynan 2012, 2013; Zhang, Martinez-Donate, and Rhoads 2015). These findings consistently indicated that female, non-Hispanic African American, non-Hispanic Asian, non-Hispanic American Indian/Alaska Native and Hispanic, older, higher-educated, and nonsmoking adults were more likely to support smoking bans in public places and cars in comparison to their counterparts (Agaku et al. 2014; B. A. King, Dube, and Tynan 2013). In the United States, additional differences in attitudes were associated with the state the families lived in (B. A. King, Dube, and Tynan 2013).
Study Goals
This study explores whether reported home smoking rules and attitudes toward smoking bans were subject to the response bias associated with the survey mode in 2010–2011 and 2014–2015. Study hypotheses include H1–H3:
-
H1: the rates of smoke-free homes and rates of attitudes toward complete smoking bans differ, on average, between reports provided in-person and by phone;
-
H2: discrepancies in the rates of smoke-free homes associated with the survey mode persist even after adjusting for parental smoking status and other parental and household characteristics;
-
H3: smokers’ reports of smoke-free homes and attitudes toward complete smoking bans are not significantly different between the survey modes.
In H3, we targeted smokers in anticipation that the survey mode should not as drastically affect smokers’ responses regarding smoking rules at home and their attitudes toward smoking bans as nonsmokers’ responses. Because smokers “admitted” their current smoking habits, they are expected to be more open about the other smoking-related measures (Johnson and Mott 2001; Kreuter, Presser, and Tourangeau 2008; Sillett et al. 1978; Tourangeau, Rips, and Rasinski 2000; Velicer et al. 1992). In addition, the smoking status of parents may influence smoking rules at home, as well as parental attitudes toward smoking bans. For example, smokers are less likely to have smoke-free rules at home (Brian A. King, Dube, and Homa 2013) and to support complete smoking bans in public places and cars (Agaku et al. 2014; Zhang, Martinez-Donate, and Rhoads 2015). While addressing the differences between the survey modes was the primary goal, there was a secondary goal to assess smoking rules at home among single-parent households and single parents’ attitudes toward smoking bans in 2010–2011 and 2014–2015.
Material and Methods
Data, Sample, and Measures
The study targeted single-parent households, i.e., households with a single 18+ year-old adult and at least one child under the age of 18. The single-parent households were identified using the following approach: the CPS data were sorted by the month of the interview, a unique household identifier, and the ages of all household members. If a household listed an individual without their age, the household was deleted from the study. The total number of adults in each household was counted and recorded using a new variable. Similarly, variables representing the total number of children in a household and an indicator of households with children aged three years or younger were created. Then these new variables were added to the TUS data set and analyzed in the study. For convenience of wording, we call adults “parents,” but because the exact relationship of the adult to the children in the household is unknown, the adults could be older siblings or guardians who are not biologically related to the children. Table 1 presents parental and household-level characteristics. In 2010–2011, 2,360 (41.0%) parents were surveyed in-person, and 3,650 (59.0%) parents were surveyed by phone. In 2014–2015, 2,422 (43.0%) parents were surveyed in person, and 3,240 (57.0%) parents were surveyed by phone. Stratification by survey period was used in all analyses.
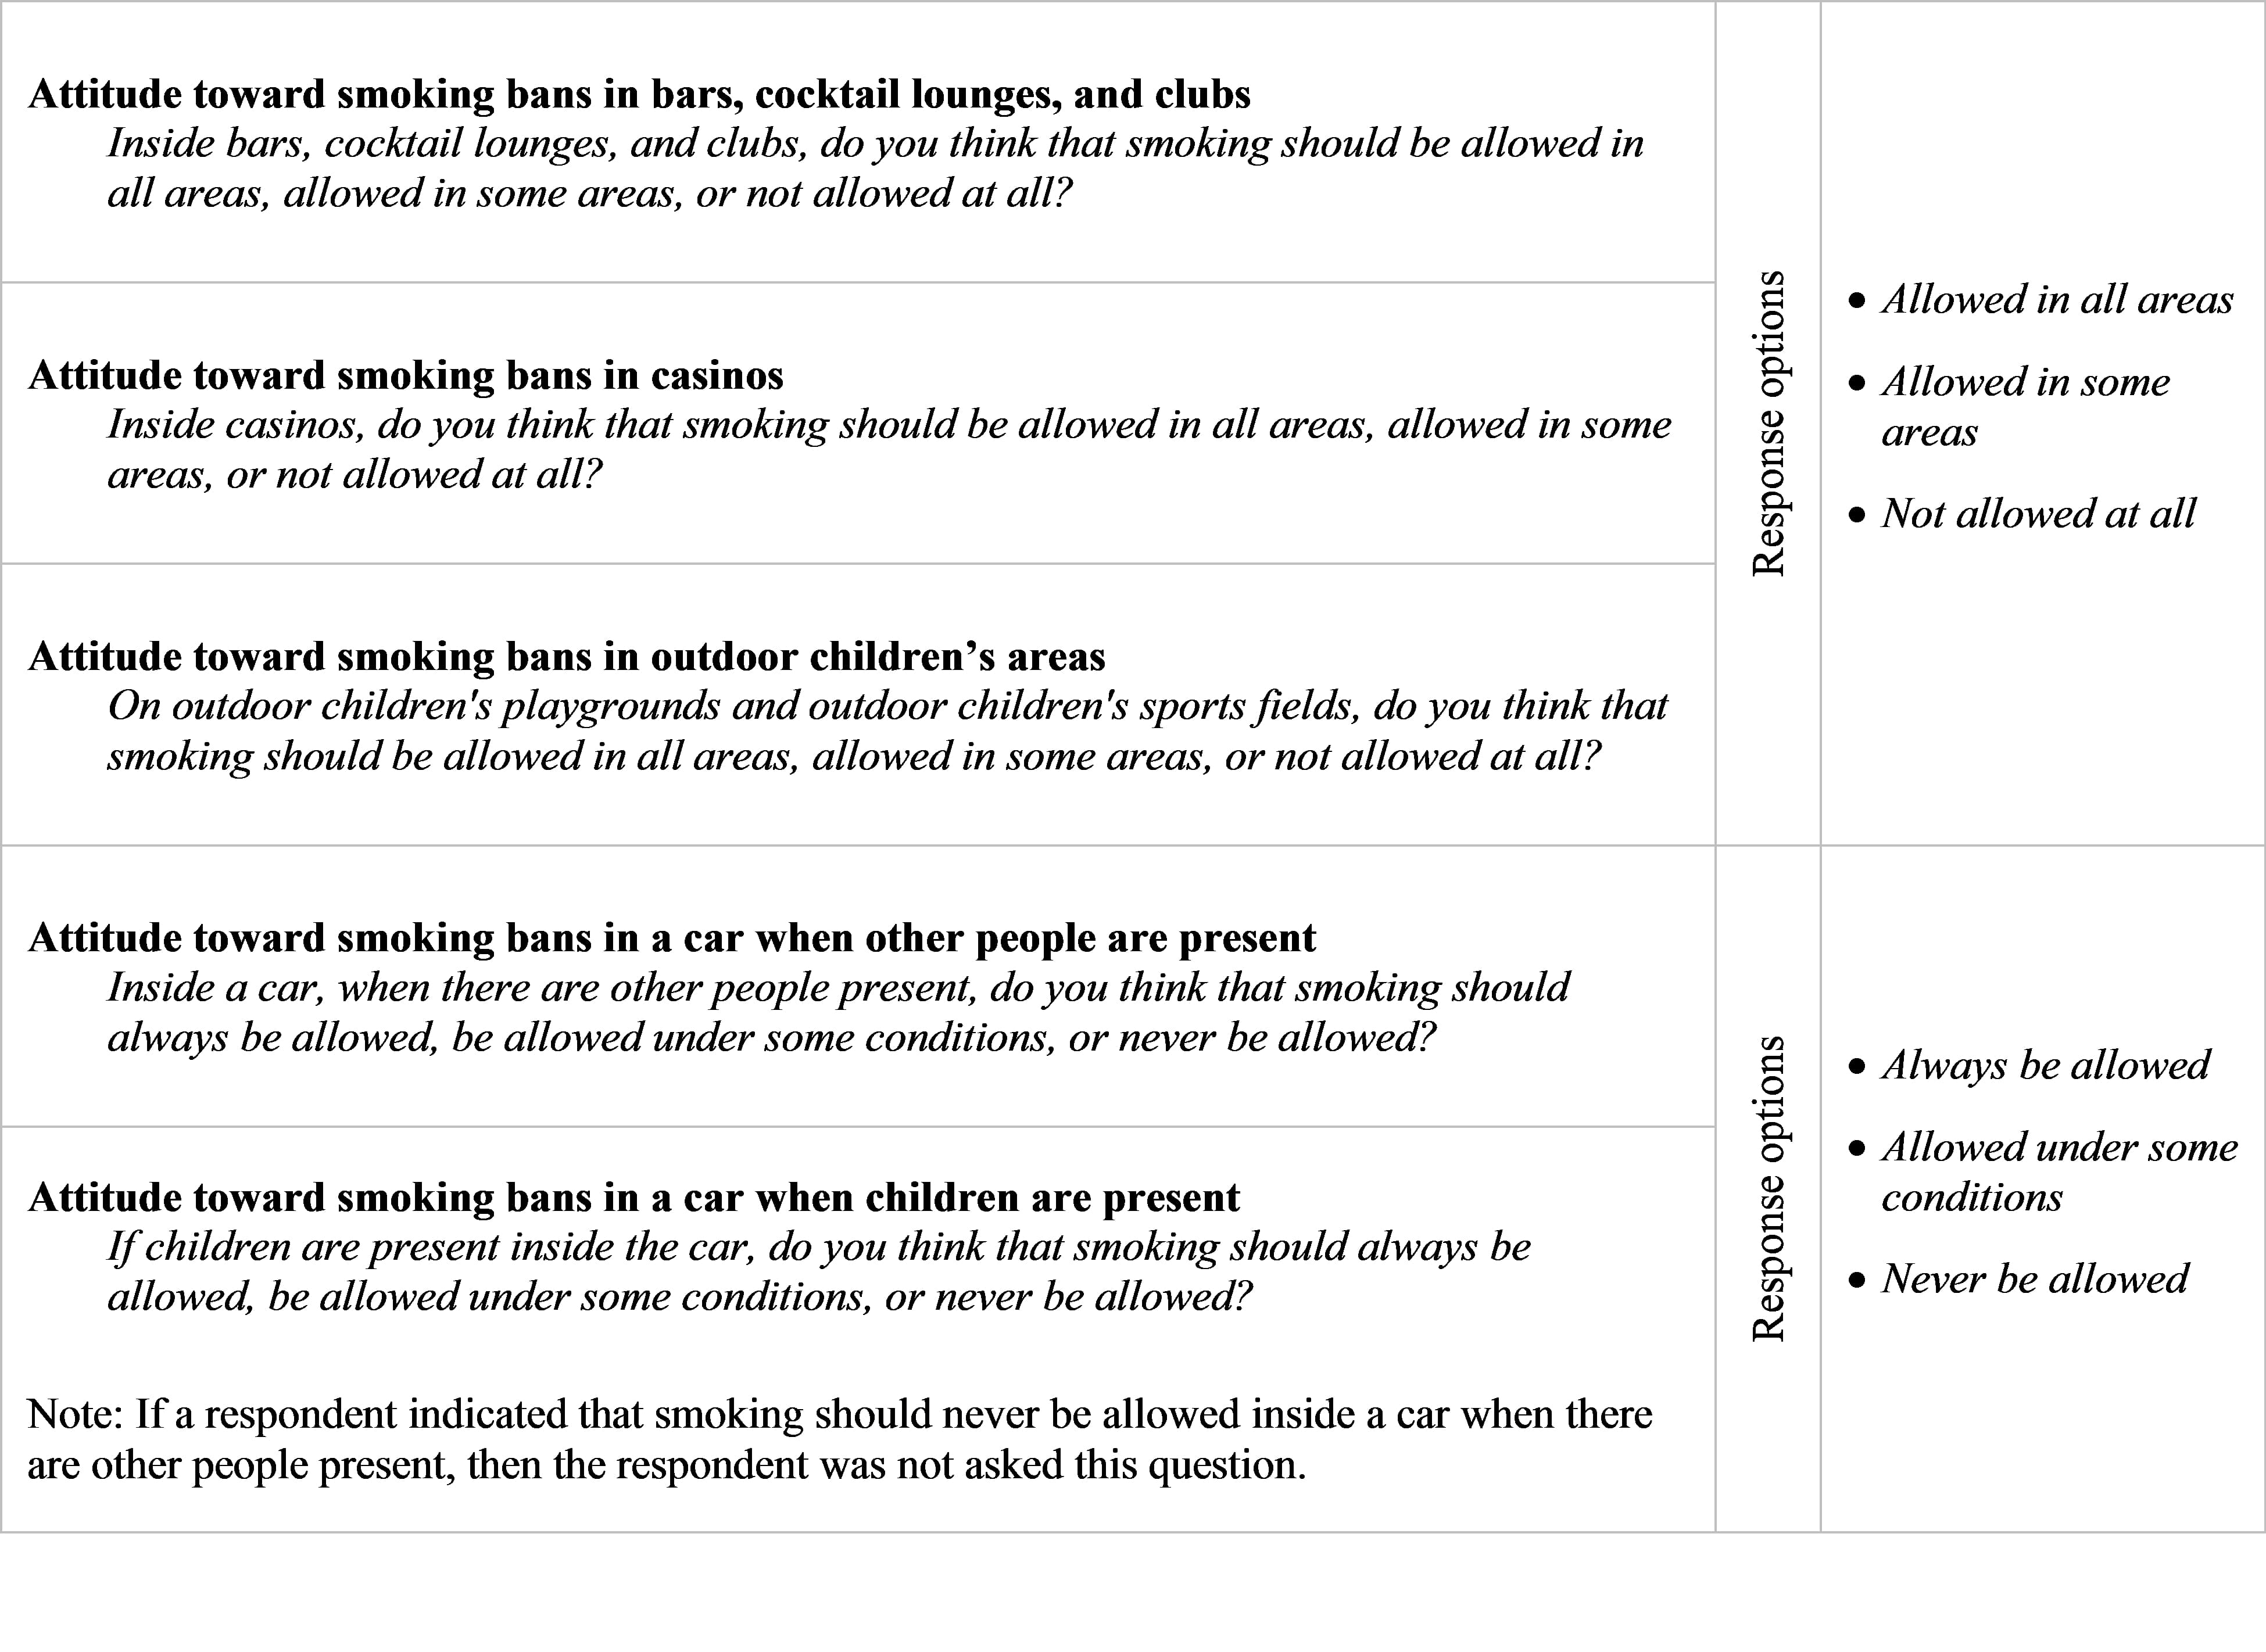
The primary measure was smoking restrictions at home. This measure was constructed using responses to the survey item, “Which statement best describes the rules about smoking inside your home: (1) no one is allowed to smoke anywhere inside your home, (2) smoking is allowed in some places or at sometimes inside your home, and (3) smoking is permitted anywhere inside your home.” The responses (1), (2), and (3) were used to identify, respectively, smoke-free homes, homes with partial smoking restrictions, and homes with no smoking restrictions. Additional measures included parental attitudes toward smoking bans in bars, casinos, outdoor children’s places, inside a car when other people are present, and inside a car when children are present. These measures were based on survey items depicted in Figure 1. Parental smoking status (never smoker, former smoker, occasional smoker, and daily smoker) and other parental and household characteristics are depicted in Table 1.

Statistical Methods
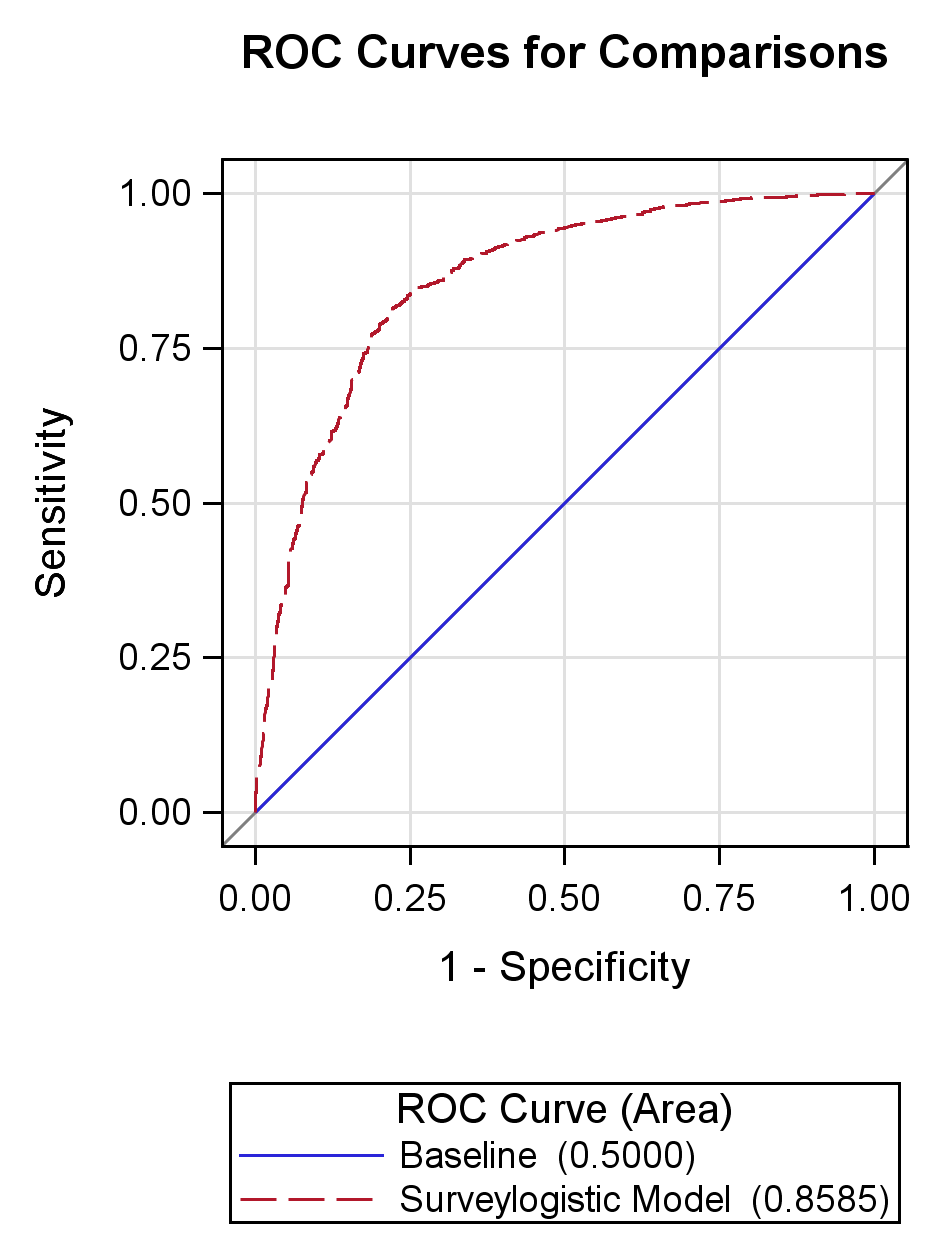
Statistical methods were adjusted for nonresponse and complex design features of the CPS (U.S. Department of Commerce and U.S. Census Bureau 2012). To test for differences in the rates of smoke-free homes and attitudes toward complete smoking bans associated with the survey mode, we used the Rao-Scott chi-square tests. The significance level for each overall test was set at the 5% level. When assessing H2 and H3, we considered binary measures, i.e., “a smoke-free home” versus “not a smoke-free home” for smoking restrictions at home and “complete bans” versus “not complete bans” for each attitudinal measure. To demonstrate H2, we built a survey multiple logistic regression model for the logit of having a smoke-free home (with the reference category “not a smoke-free home”) using 2010–2011 data. The model controlled for all sociodemographic characteristics of parents. The two-way interactions between the survey mode and other factors, as well as significance of attitudes as main effects, were explored at the 5% level. Because all two-way interactions, as well as the main effect of attitudes toward complete smoking bans at casinos, were not significant at the 5% level, they were not included in the final model. The final model for the logit of having a smoke-free home was fitted to 2010–2011 data The same set of covariates was used to identify the model coefficients using 2014–2015 data Figure 2 and Figure 3 illustrate that both models adequately fit the corresponding data.
_curve_for_the_20102011_tus-cps_model.png)
_curve_for_the_20142015_tus-cps_model.png)
When performing multiple comparisons, we used Bonferroni adjustments. In a case of two comparisons, for example, the adjusted p-value was computed as the original p-value multiplied by two. Then the adjusted p-values were compared to the 5% significance level.
Results
Survey Mode and Reported Smoking Restrictions at Home and Attitudes Toward Complete Smoking Bans.
The overall rate of smoke-free homes was 82.1% in 2010–2011 and 86.3% in 2014–2015. Table 2 illustrates the percentages and results of comparisons between reports provided in-person and by phone. In 2010–2011 and 2014–2015, significant overall differences across the survey modes existed in home smoking rules and attitudes toward smoking bans in bars and casinos. In addition, in 2010–2011 there was a significant overall difference in attitudes toward smoking bans in a car when children are present. Table 2 also illustrates that the patterns were consistent for all measures: personal interviews corresponded to lower rates of smoke-free homes and support for complete bans than did phone interviews. Likewise, personal interviews corresponded to higher rates of homes with no smoking restrictions and support for “no smoking bans” in comparison to phone interviews.
Discrepancies in the Rates of Smoke-Free Homes Associated with Survey Mode Persist Even After Adjusting for Parental and Household Characteristics.
Both models indicated that even after adjustment for other factors, the effect of the survey mode was significant (2010–2011: 2014–15: Specifically, personal interviews resulted in lower odds of smoke-free homes relative to phone interviews. Tables 3 and 4 depict results for the survey mode and other common significant factors, i.e., parental smoking status, race/ethnicity, education, employment status, having toddlers, and region of residency (all ’s In addition, consistent findings were observed between smoke-free homes and attitudinal factors. Significant attitudinal factors included attitudes toward complete smoking ban in bars, outdoor children places, cars when other people are present, and cars when children are present (all ’s In 2010–2011, there also was a significant difference in the odds of having a smoke-free home in metropolitan areas of residence : the higher odds of a smoke-free home corresponded to households in metropolitan areas rather than nonmetropolitan areas Parental age, sex, and marital status were not significant in either model; these ORs are not shown.
Survey Mode and Smokers’ Reports of Smoking Restrictions at Home and Attitudes Toward Complete Smoking Bans.
There was no significant association between smoking rules at home and the survey mode among smokers in 2010–2011 or 2014–2015. In 2010–2011, there were some discrepancies associated with the survey mode in smokers’ attitudes toward complete smoking bans in casinos and in a car when children are present With respect to smoking bans in casinos, the rate of smokers’ support was 15.4% for personal and 20.8% for phone interviews (adjusted With respect to smokers’ support for complete smoking bans in cars when children are present, the rates of support were 77.5% for personal and 83.2% for phone interviews (adjusted Also, with respect to support for “no smoking bans in cars when children are present,” the rates were 5.2% for personal and 2.1% for phone interviews (adjusted There were no significant associations in any smokers’ measures associated with the survey mode in 2014–2015.
Discussion
This study indicates the importance of considering and adjusting for the survey mode when a survey utilizes different modes to collect information. Among single-parent households, in particular, the estimated rates of smoke-free homes and parental attitudes toward complete smoking bans were lower for personal interviews than for phone interviews. While not consistent, some additional differences in attitudinal measures among smoking parents were observed. Further investigation, which controlled for a number of parental characteristics and attitudes, also indicated that smoke-free homes were less commonly reported during personal interviews than during phone interviews. The lack of significant interactions indicated that the differences in the rate of smoke-free homes associated with the survey mode were similar across populations with diverse parental and household characteristics. For example, the difference in the prevalence of smoke-free homes corresponding to personal and phone interviews was similar for never, former, occasional, and daily smokers. The observed associations between the survey mode and prevalence of smoke-free homes were also consistent across the two survey periods, 2010–2011 and 2014–2015.
The association between survey mode and reported smoking rules at home and attitudes toward smoking bans observed in this study suggests that phone interviews—rather than personal interviews—are more likely to be associated with reporting positive events. This is similar to our previously reported finding for current smoking, where nonsmoking was more commonly reported by phone than in-person (Soulakova et al. 2009) and also similar to another study, where obesity was less prevalent for phone interviews (13%) than it was for personal interviews (18%) (St-Pierre and Béland 2004). The observed effect could be due to multiple reasons. First, respondents are less likely to be able to “hide” the fact that their home is not smoke-free in a personal interview because the interview is conducted at their home (U.S. Bureau of Labor Statistics and U.S. Census Bureau 2006). Second, respondents surveyed by phone could be more likely to overreport socially desirable events such as having a smoke-free home and their support for smoking bans, relative to respondents surveyed in-person (Holbrook, Green, and Krosnick 2003; Krumpal 2013; De Leeuw et al. 2008; Szolnoki and Hoffmann 2013; Zhang et al. 2017). Therefore, adjustments for the survey mode as well as other factors should be incorporated when estimating the odds of having a smoke-free home or other smoking-related outcomes.
The estimated rate of smoke-free homes among single-parent households was 82% in 2010–2011. Comparison to the prior estimate of smoke-free homes in 2010–2011 of 83% (B.A. King, Patel, and Babb 2014) indicates the overall consistency of the findings. Similarly, the predicted rate of smoke-free homes among single-parent households with a nonsmoking parent in 2010–2011 (after controlling for the survey mode) was 89%, which is comparable to 91% estimated for households where all adults are nonsmokers (B.A. King, Patel, and Babb 2014). However, our finding that the rate of smoke-free homes among single-parent households with the smoking parent in 2010–2011 (after controlling for the survey mode) of 53% appears to be higher than the rate of 46% for the households where at least one adult was a smoker (B.A. King, Patel, and Babb 2014). The observed discrepancy could be due to diverse smoking restrictions between single-parent households and general households. Specifically, general households include those with no children and those with older adults. These households are less likely to have smoking restrictions at home (“Smoke-Free Home Rules | Cancer Trends Progress Report” 2017; Zhang et al. 2011).
While the study did not explore the significance of longitudinal trends in the prevalence of smoke-free homes in single-parent households from 2010–2011 to 2014–2015, ancillary evaluation of study findings and prior research suggests that the rate of smoke-free homes kept increasing over the past decades. Specifically, the rate of smoke-free homes in single-parent households increased from 46% in 1995–2096 to 75% in 2006–2007 (Zhang et al. 2011) and then from 82% in 2010–2011 to 86% in 2014–2015. These estimates suggest a continuation of this positive trend.
Our study has several limitations. Due to the observational nature of the study, all results should suggest “associations only” rather than “dependence,” “impact,” and/or “causality.” The study did not incorporate an experimental design, and thus, it is not suitable for assessing the latter cause-effect relationships. We also had to exclude households with parents of certain ages and races/ethnicities due to poor representation of these groups in the samples. For example, only about 1% of parents were 65+ years old. Future studies addressing these subpopulations would help enhance current knowledge regarding exposure to secondhand smoke at home. Future studies should examine smoking rules among two-parent households and households with diverse racial/ethnic and cultural representation and identify the most vulnerable populations.
Conclusion
Creating and maintaining a smoke-free home environment not only helps reduce exposure for children and adult nonsmokers but also may help adult smokers during their attempts to quit (Messer et al. 2008; Mills et al. 2011; Shopland, Anderson, and Burns 2006). Our study illustrates the importance of the survey mode when monitoring the rates of smoke-free homes and other smoking-related attitudes and behaviors. Researchers should be aware of potential response biases associated with the survey mode and possible discrepancies in the estimates of different survey modes.
Acknowledgments and Funding
We are thankful to James Holland for proof reading the paper. Research reported in this publication was supported by the National Institute on Minority Health and Health Disparities of the National Institutes of Health under Award Number R01MD009718. The content is solely the responsibility of the authors and does not necessarily represent the official views of the National Institutes of Health.
Declaration of Interests
None declared.