Processing math: 100%
Skip to main content
Survey Practice
  • Menu
  • Articles
    • Articles
    • Editor Notes
    • In-Brief Notes
    • Interview the Expert
    • Recent Books, Papers, and Presentations
    • All
  • For Authors
  • Editorial Board
  • About
  • Issues
  • Blog
  • Subscribe
  • search

RSS Feed

Enter the URL below into your favorite RSS reader.

http://localhost:7386/feed
Articles
Vol. 15, Issue 1, 2022April 21, 2022 EDT

Transitioning the FDA Food Safety and Nutrition Survey from RDD to ABS

Martine Ferguson, Amy M. Lando, Fanfan Wu, Linda Verrill,
Mode comparisonFDAFood Safety and Nutrition SurveyFSANS
https://doi.org/10.29115/SP-2022-0003
Photo by Firmbee.com on Unsplash
Survey Practice
Ferguson, Martine, Amy M. Lando, Fanfan Wu, and Linda Verrill. 2022. “Transitioning the FDA Food Safety and Nutrition Survey from RDD to ABS.” Survey Practice 15 (1). https:/​/​doi.org/​10.29115/​SP-2022-0003.
Save article as...▾
Download all (6)
  • Figure 1. Measurement model for Food Safety Perception.
    Download
  • Figure 2. Measurement model for Nutrition Awareness.
    Download
  • Figure 3. Measurement model for Food Handling Behavior.
    Download
  • Supplemental Material
    Download
  • Supplemental Figure 1
    Download
  • Table titles
    Download

Sorry, something went wrong. Please try again.

If this problem reoccurs, please contact Scholastica Support

Error message:

undefined

View more stats

Abstract

Household probability surveys are useful for monitoring self-reported behaviors and beliefs over time. Historically, many large government surveys were conducted as random digit dialing (RDD), interview-administered surveys. As response rates for RDD surveys have decreased and associated costs increased, researchers have turned to other survey sampling methods such as address-based (ABS) mail and web surveys. While transitioning survey modes have become relatively common in the last two decades, significant care must be taken to understand the potential shifts in biases which may occur as a result of the change of mode of administration and determine if survey trends can be accurately reported. Using the U.S. Food and Drug Administration’s Food Safety and Nutrition Survey, this paper provides an in-depth RDD to ABS web and paper mode comparison, systematically examining each source of potential bias, including those due to compositional differences between the survey samples and those due to different collection modes. By laying out a step-by-step guide for how to test for bias due to non-response, mode measurement biases, straightlining, social desirability, and acquiescence, the paper serves as a guide to survey researchers seeking to transition survey modes. Our findings highlight the importance of comprehensively assessing survey biases, so that researchers can feel confident about the overall success of the survey transition while also pinpointing specific questions (or topics) that may require additional work before making trends comparisons.

1. INTRODUCTION

Household probability surveys are useful for monitoring self-reported behaviors and beliefs over time.

As telephone random digit dialing (RDD) surveys suffer from continued and increasingly low response rates (Pierannunzi et al. 2019; Link et al. 2008); increasing costs associated with each interview (Guterbock et al. 2011); and increased field time needed to complete RDD surveys (Guterbock et al. 2011), researchers conducting RDD surveys have been experimenting with different strategies to improve survey participation and quality. One strategy that has been employed by many U.S. federal and state government sponsored health focused surveys is to transition RDD phone surveys to address-based mail or mixed-mode (mail and web) surveys. Some of these include the following: the Health Information National Trends Survey (HINTS; Finney Rutten et al. 2012; Peytchev, Ridenhour, and Krotki 2010), Behavioral Risk Factor Surveillance System (BRFSS) (Link et al. 2006) and the California Health Interview Survey (CHIS; Wells 2020).

While transitioning survey modes have become relatively common in the past two decades, significant care must be taken to understand the potential shifts in biases which may occur because of the change of mode of administration and to determine if survey trends can be accurately reported. The two main sources of potential bias when transitioning RDD to address-based sampling (ABS) are (1) sampling bias, resulting from differences in the makeup of the survey samples and differences in unit (sampled person) non-response between the two modes (RDD vs. ABS) and (2) measurement bias, resulting from the use of different data collection modes: phone interviews (RDD), online responses (ABS-web), and pencil and paper responses (ABS-paper).

This paper systematically examines each form of potential survey bias (see Table 1 for list of biases examined) and serves as a guide to survey researchers, seeking to transition survey modes, using a U.S. Food and Drug Administration (FDA) household probability survey to structure the discussion. We begin with a comparison of sampling bias due to sample composition differences and respondent non-response (section 3.1). We then assess measurement bias by testing for mode measurement equivalence (section 3.2); straightlining (section 3.3); and finally, social desirability and acquiescence (section 3.4). By comprehensively examining biases, researchers can make conclusions about the overall success of the survey transition while also pinpointing specific questions that may require additional work before making trends comparisons.

2. DATA

2.1. Survey populations and sampling methods

Since the 1980s, the FDA regularly conducted national probability, cross-sectional, RDD interviewer-administered surveys to track consumer knowledge, exposure to and understanding of key food safety and nutrition messages, and related reported behaviors. In 2019, the FDA combined questions from the previous surveys and administered the FDA Food Safety and Nutrition Survey (FSANS) as an ABS, self-administered web and paper (paper and pencil) survey.

To assess the effects of the changes in survey administration mode, undistorted by temporal effects, the 2019 FSANS used a mixed-mode, parallel design, with participants assigned to ABS or RDD. This mixed-mode, parallel design provided an opportunity for mode measurement bias testing that few studies offer (Couper 2011).

Questions about food safety, health, and diet were included in the 2019 FSANS. There were two versions for each survey mode—one that focused on food safety and one that focused on nutrition. Two versions were needed to be able to include all questions of interest without burdening respondents with very long survey questionnaires. The RDD and ABS mode were designed to take 15 minutes and 20 minutes, respectively, to complete. The respondents for all versions of the survey were English- or Spanish-speaking non-institutionalized adults (≥18 years old) living in the 50 U.S. states and the District of Columbia.

Prior to conducting the survey, three rounds of cognitive interviews and a pretest were conducted to enhance survey understandability, minimize respondent fatigue, and ensure data integrity (completeness).

For details regarding the RDD and ABS sampling methods please refer to the Supplemental Material (S.1). The RDD data were collected from October 14, 2019, through December 22, 2019, and yielded a sample of 834 respondents, 415 of which were randomly assigned the Food Safety (FS) version, and 419 of which were assigned the Nutrition (N) version. The ABS data were collected from October 1, 2019, through November 2, 2019, and yielded a sample of 4,398 respondents, 2,227 of which were randomly assigned the FS version, and 2,171 of which were assigned the N version.

Survey data were weighted to account for sampling design and non-response. The sampling weights were calculated, separately for the RDD and ABS samples, to control for differential probabilities of selection (within household and across socio-demographic group).

The survey questions can be found in the 2019 FSANS report at https://www.fda.gov/food/science-research-food/2019-food-safety-and-nutrition-survey-report.

3. METHODS and RESULTS

In this section, we present the methods used to assess sampling bias and the results of each. We then present the methods used to assess mode measurement biases (each adjusted for any sampling bias found) and their results. Table 1 summarizes the methods used. Throughout this discussion, unless stated otherwise, data are weighted (i.e., sampling weights have been applied), and unless stated otherwise, all statistical analyses were performed using SAS 9.4 (SAS Institute, Cary, NC) and variances were estimated using Taylor series linearization (TSL). TSL is a method often used for computing the variance of a complex sample by reducing the form of a point estimate to a linear form by applying Taylor approximation and then uses the variance estimate for this linear approximation to estimate the variance of the point estimate (Woodruff 1971).

Table 1.Summary of biases examined.
Bias Source Bias Description In This Paper
Sampling bias Sample composition Differences in sample selection are due to the use of different survey sampling frames for RDD and ABS samples (Link et al. 2008). Differences in coverage (i.e., coverage bias) can arise from different modes potentially attracting different kinds of respondents to take the survey (Sterrett et al. 2017). Section 3.1.1
Respondent non-response Potential differences in respondent non-response between modes have to do with potential differences in the number and type of invited sampled persons who chose not to participate in the survey (Groves and Peytcheva 2008). Section 3.1.2
Measurement bias Mode measurement unequivalence Differences due to respondents answering a question differently because of the way the question is presented (Hox, De Leeuw, and Klausch 2017, chap. 23); the differences may also be situational and/or motivational (Hox, De Leeuw, and Chang 2012). Section 3.2
Straightlining or satisficing The tendency of providing satisfactory but not optimal answers to reduce effort (Krosnick 1991). Straightlining, a kind of satisficing, is responding with identical ratings to a series of questions (Zhang and Conrad 2014). Section 3.3
Acquiescence bias The tendency of the respondent to favor the ‘yes’ or ‘agree with’ answer regardless of the content of the question (Heerwegh and Loosveldt 2011). Section 3.4
Social desirability bias The bias caused by participants under-reporting socially undesirable behaviors and/or over-reporting socially desirable behaviors to comply with social norms, is a major source of response bias in survey research (DeMaio 1984; Kreuter, Presser, and Tourangeau 2008). Section 3.4

3.1. Sampling Bias: Sample Composition and Unit Non-response

3.1.1 Sample Composition—Methods Bivariate logistic regression, unweighted and weighted, was used to test for differential sample composition across mode. Since the ABS-web and ABS-paper were from the same sampling frame, the RDD sample was compared to the combined ABS-web and ABS-paper sample. Mode was regressed on each respondent characteristic: age, race and Hispanic origin, education, gender, income, urbanicity, region and home ownership.

Results: The differences in sample composition are presented in Table 4. Applying the survey sampling weights, successfully corrects for the mode sampling bias for all covariates adjusted for in the weight calibration process—i.e., gender, age, race and Hispanic origin, education, census region and urbanicity. Regarding the respondent characteristics not accounted for in the weight calibration process, income and home ownership, the combined weighted ABS-web/paper sample consisted of more homeowners and more high-income respondents than the weighted RDD sample.

Table 4.Sample composition: comparing ABS respondent characteristics to RDD respondent characteristics.
Respondent Characteristics Question Answer Unadjusted Percentages
Unweighted Weighted
RDD Combined ABS
-web/paper
RDD Combined ABS
-web/paper
Age In what year were you born? (Converted to age and categorized) 18-30 yrs 14.2 9.2*** 23.1 20.3
31-50 yrs 26.6 26.5 32.2 35.4
51-50 yrs 18.0 18.8 16.6 17.5
>60 yrs 41.2 45.5** 28.1 26.7
Race and Hispanic origin What is your race? Are you Hispanic or Latino? (Aggregated and categorized) White 67.6 75.5*** 65.3 65.4
Non-Hispanic Black 8.8 7.4 10.3 11.7
Hon-Hispanic Other 12.1 10.0 8.8 7.3
Hispanic 11.6 7.2** 15.6 15.7
Education What is the last grade or year of school that you have completed? HS or less than HS 28.5 24.2* 40.5 40.0
Some college 29.3 28.3 30.5 31.0
College graduate 42.2 47.5** 29.0 29.0
Gender How do you describe yourself? Male or Female. Male 51.0 37.2*** 48.7 48.7
Female 49.0 62.8 51.3 51.3
Income What was your total household income before taxes during the past 12 months? Less than $25K 17.8 15.2 22.1 18.0
$25K - $49,999 23.2 22.9 23.9 25.1
$50K - $99,999 34.8 32.2 33.8 30.6
$100K+ 24.2 29.8** 20.2 26.2*
Urbanicity Urban or rural zip code (Mapped using Rural-Urban Commuting Area Codes (RUCA)) Urban 82.0 85.6 83.6 84.9
Rural 18.0 14.4** 16.4 15.1
Region Census Bureau-designated regions (Mapped using zip code/state) Northeast 14.7 19.0** 18.2 17.8
Midwest 20.5 24.7* 21.6 21.0
South 36.6 34.4 36.5 37.7
West 28.2 21.8*** 23.7 23.5
Home ownership Do you: Own your own home, Rent your home, or Have some other arrangement? No/Other 41.6 26.3*** 47.2 37.4**
Yes 58.4 73.7 52.8 62.6

The regression slope was estimated for each respondent characteristic and category (Answer).
Each slope tested for significant difference from 0: (t-test)* p<.05, ** p<.01, *** p<.0001

3.1.2 Unit Non-response– Methods Non-response bias arises when survey respondents have different characteristics than the non-respondents, and those characteristics are correlated with survey estimates. Although, by definition, survey responses are unknown for non-respondents and thus non-response bias cannot directly be assessed, respondent characteristics of RDD and ABS (web/paper combined) were compared to the general U.S. population characteristics, as reported by the 2014-2018 American Community Survey (ACS; United States Census Bureau, n.d.), to ascertain potential non-response bias. Response rates in this paper were calculated using the American Association of Public Opinion Research (AAPOR) Response Rate 3 (RR3) formulation.

Results: The RDD RR3 was 6.6% and the ABS RR3 was 28.1%. There were indications of non-response bias related to age, education, gender, and race/ethnicity for both RDD and ABS (information available upon request). Notably, the RDD respondents trended slightly more male than the U.S. population, while ABS respondents trended more female than the U.S. population. Raking of the sampling weights to the ACS demographic control totals was performed to reduce these observed non-response biases in RDD and ABS.

3.2. Mode Measurement Equivalence

Methods The three modes (RDD, ABS-web, and ABS-paper) were assessed for measurement equivalence (ME). ME (also known as measurement invariance) is defined as ‘‘whether or not, under different conditions of observing and studying phenomena, measurement operations yield measures of the same attribute’’ (Horn and McArdle 1992). ME was assessed using multiple group confirmatory factor analysis (MGCFA) through a series of increasingly stringent models (Table 2), i.e., increasing number of constraints (Martinez-Gomez, Marin-Garcia, and Giraldo O’Meara 2017): (1) configural invariance; (2) metric invariance; (3) partial scalar invariance; (4) strict scalar invariance (Hox, De Leeuw, and Zijlmans 2015); and (5) latent factor variance invariance.

Table 2.Mode measurement equivalence: levels of invariance (sorted from least to most stringent).
Level of invariance Interpretation Number of constraints Constraint
Factor loadings equal Intercepts equal Residual variances equal Latent variable variances equal
Configural
(base model)
Ascertains whether a relationship exists between observed variables and their underlying latent construct. In other words, is the same general pattern of factor loadings present for each mode (RDD, ABS-web, ABS-paper) (Hox, De Leeuw, and Zijlmans 2015). 0
Metric Respondents from the three modes attribute the same meaning to the latent variable (van de Schoot, Lugtig, and Hox 2012). 1 x
Partial scalar Respondents from the three modes attribute the same meaning to both the latent variable (i.e., equal factor loadings) and to the observed survey questions (i.e., equal intercepts) (van de Schoot, Lugtig, and Hox 2012). 2 x x
Strict scalar Latent variables are measured with the same precision across mode (van de Schoot, Lugtig, and Hox 2012). 3 x x x
Latent factor variance Latent variables have the same precision across mode (Xu 2012). 4 x x x x

Model fits are generally considered good when the Root Mean Square Error of Approximation is low (RMSEA <.08) and the Comparative Fit Index is high (CFI >.90) (Van de Schoot et al., 2012). Further information about the model fit criteria can be found in the Supplemental material (S.2.1). As Barrett (2007) suggests, we calculated confidence intervals around the fit indices to parallel the logic of statistical inference of the chi-square test.

The five models are tested in sequence, looking for fit non-decreases (i.e., non-worsening) in chi square using the Satorra-Bentler scaled chi-square difference test (SBSD) (Satorra and Bentlee 2001). A non-significant SBSD test accompanied by a drop in CFI of at most .01 and an increase in RMSEA of at most .015 (Chen 2007) indicates the additional constraint will not cause a significant decrease in model fit. The model constraint can then be retained and the level of invariance to which the model corresponds is supported. Otherwise, that level of invariance is not established.

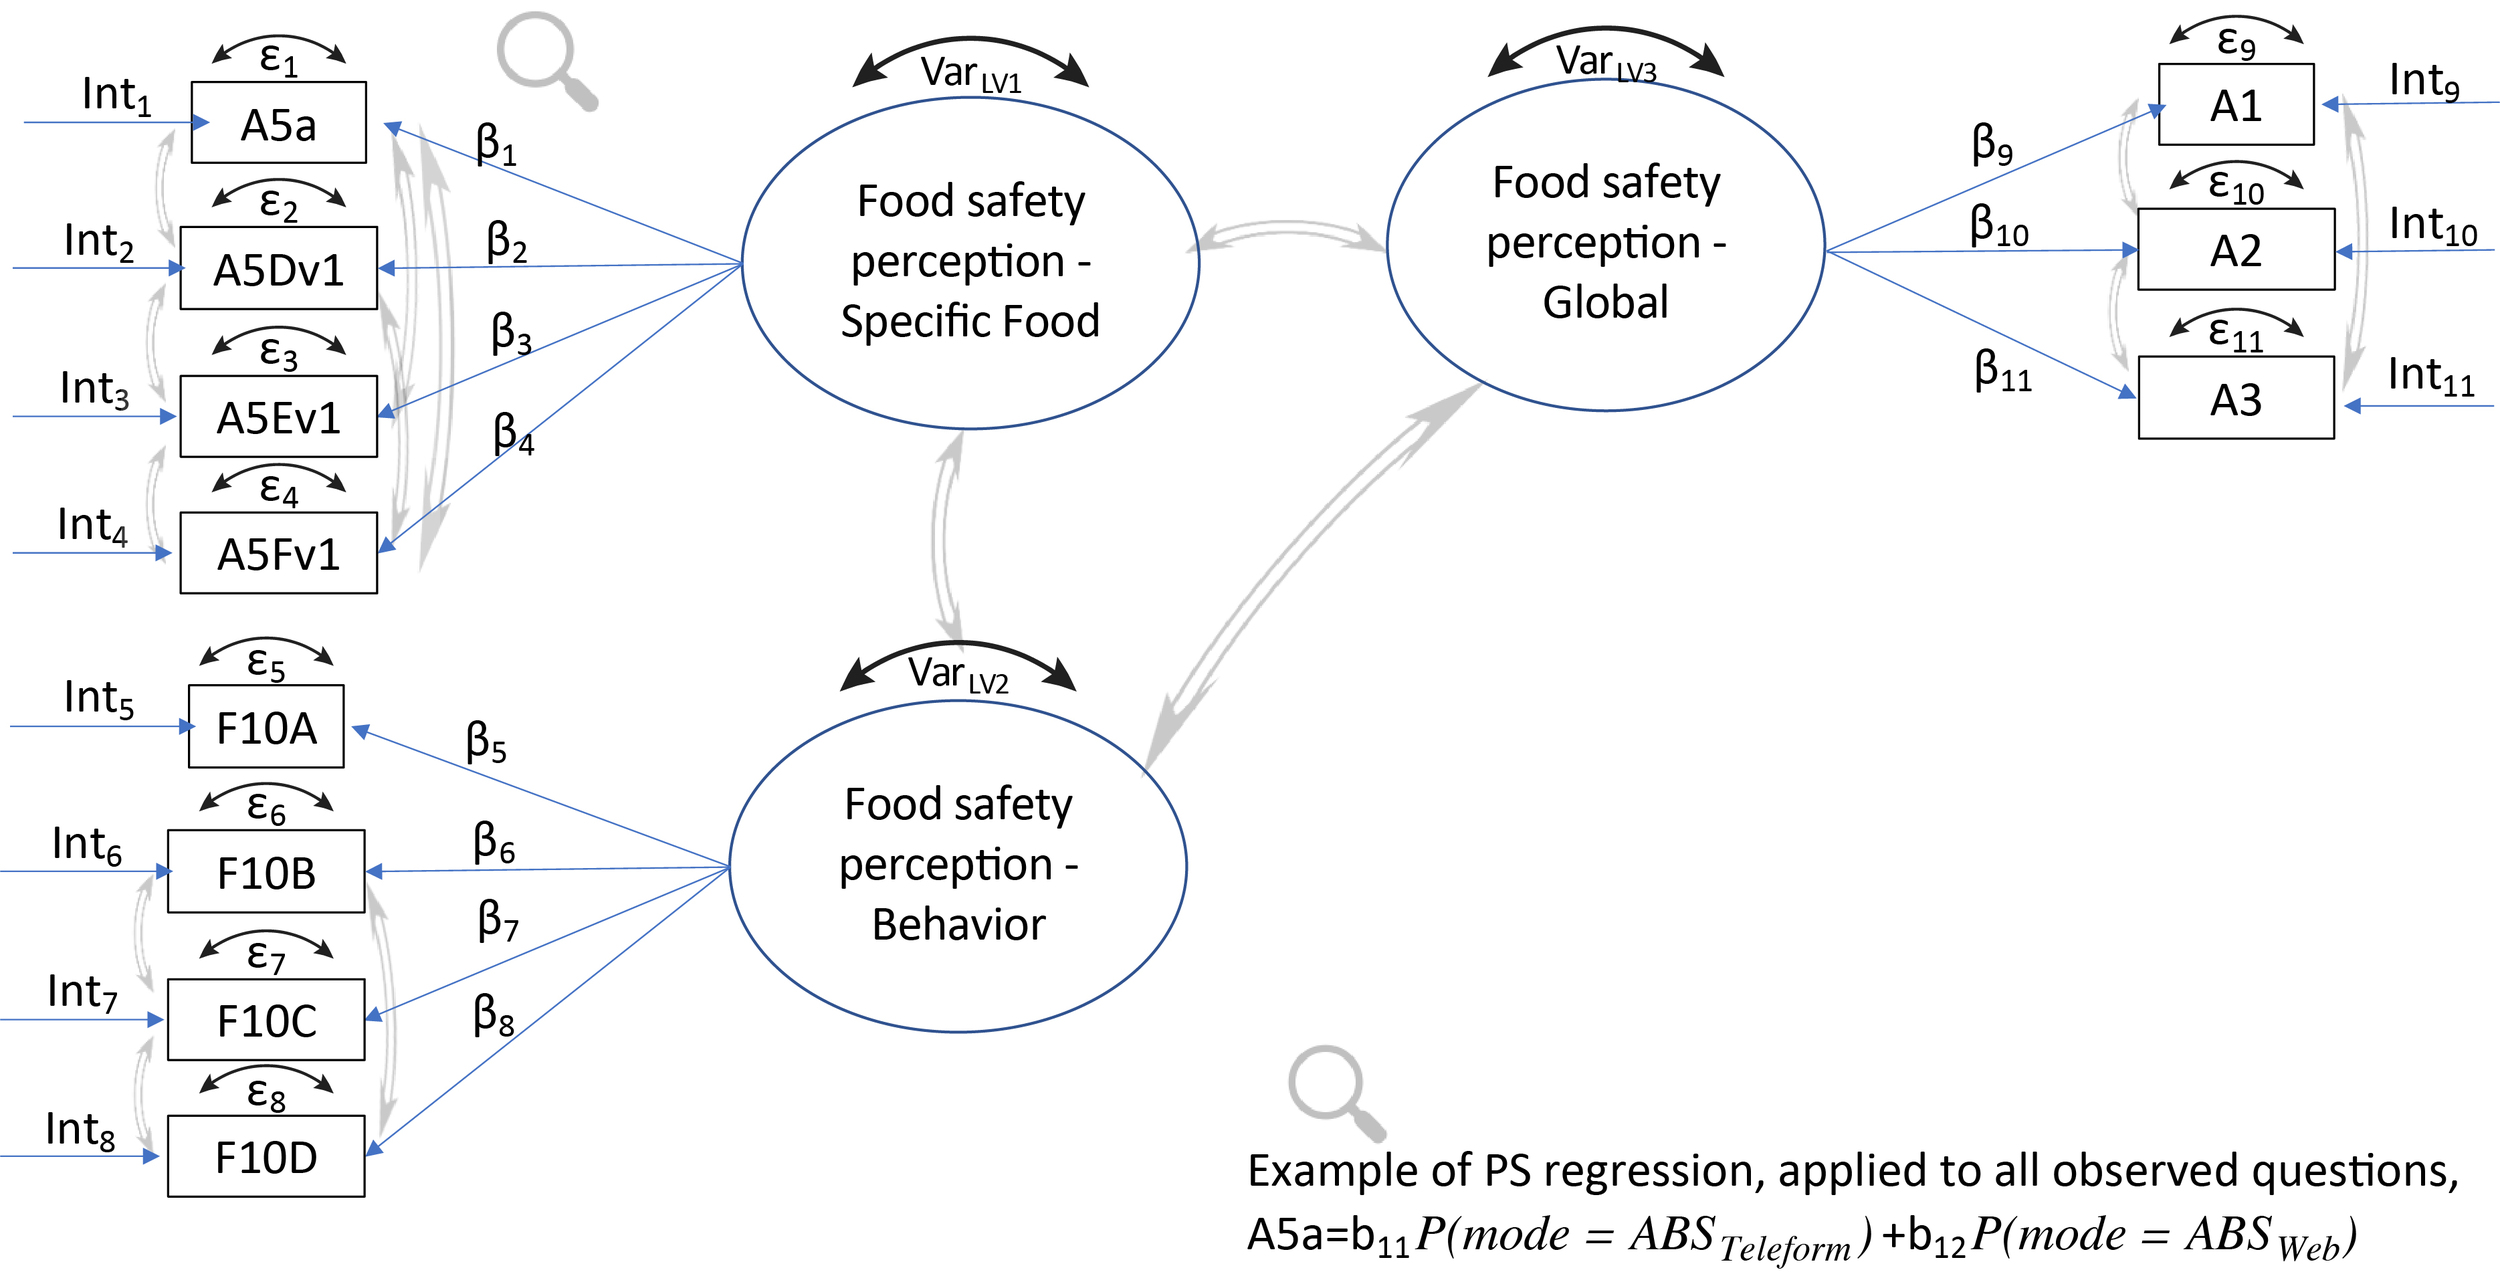
To avoid confounding sample compositional differences with mode measurement bias, the observed survey questions in the ME models were adjusted for mode selection effects using multiple propensity scores (Spreeuwenberg et al. 2010); i.e., adjusted for sampling bias. A discussion of the propensity scores can be found in the Supplemental material (S.2.2).

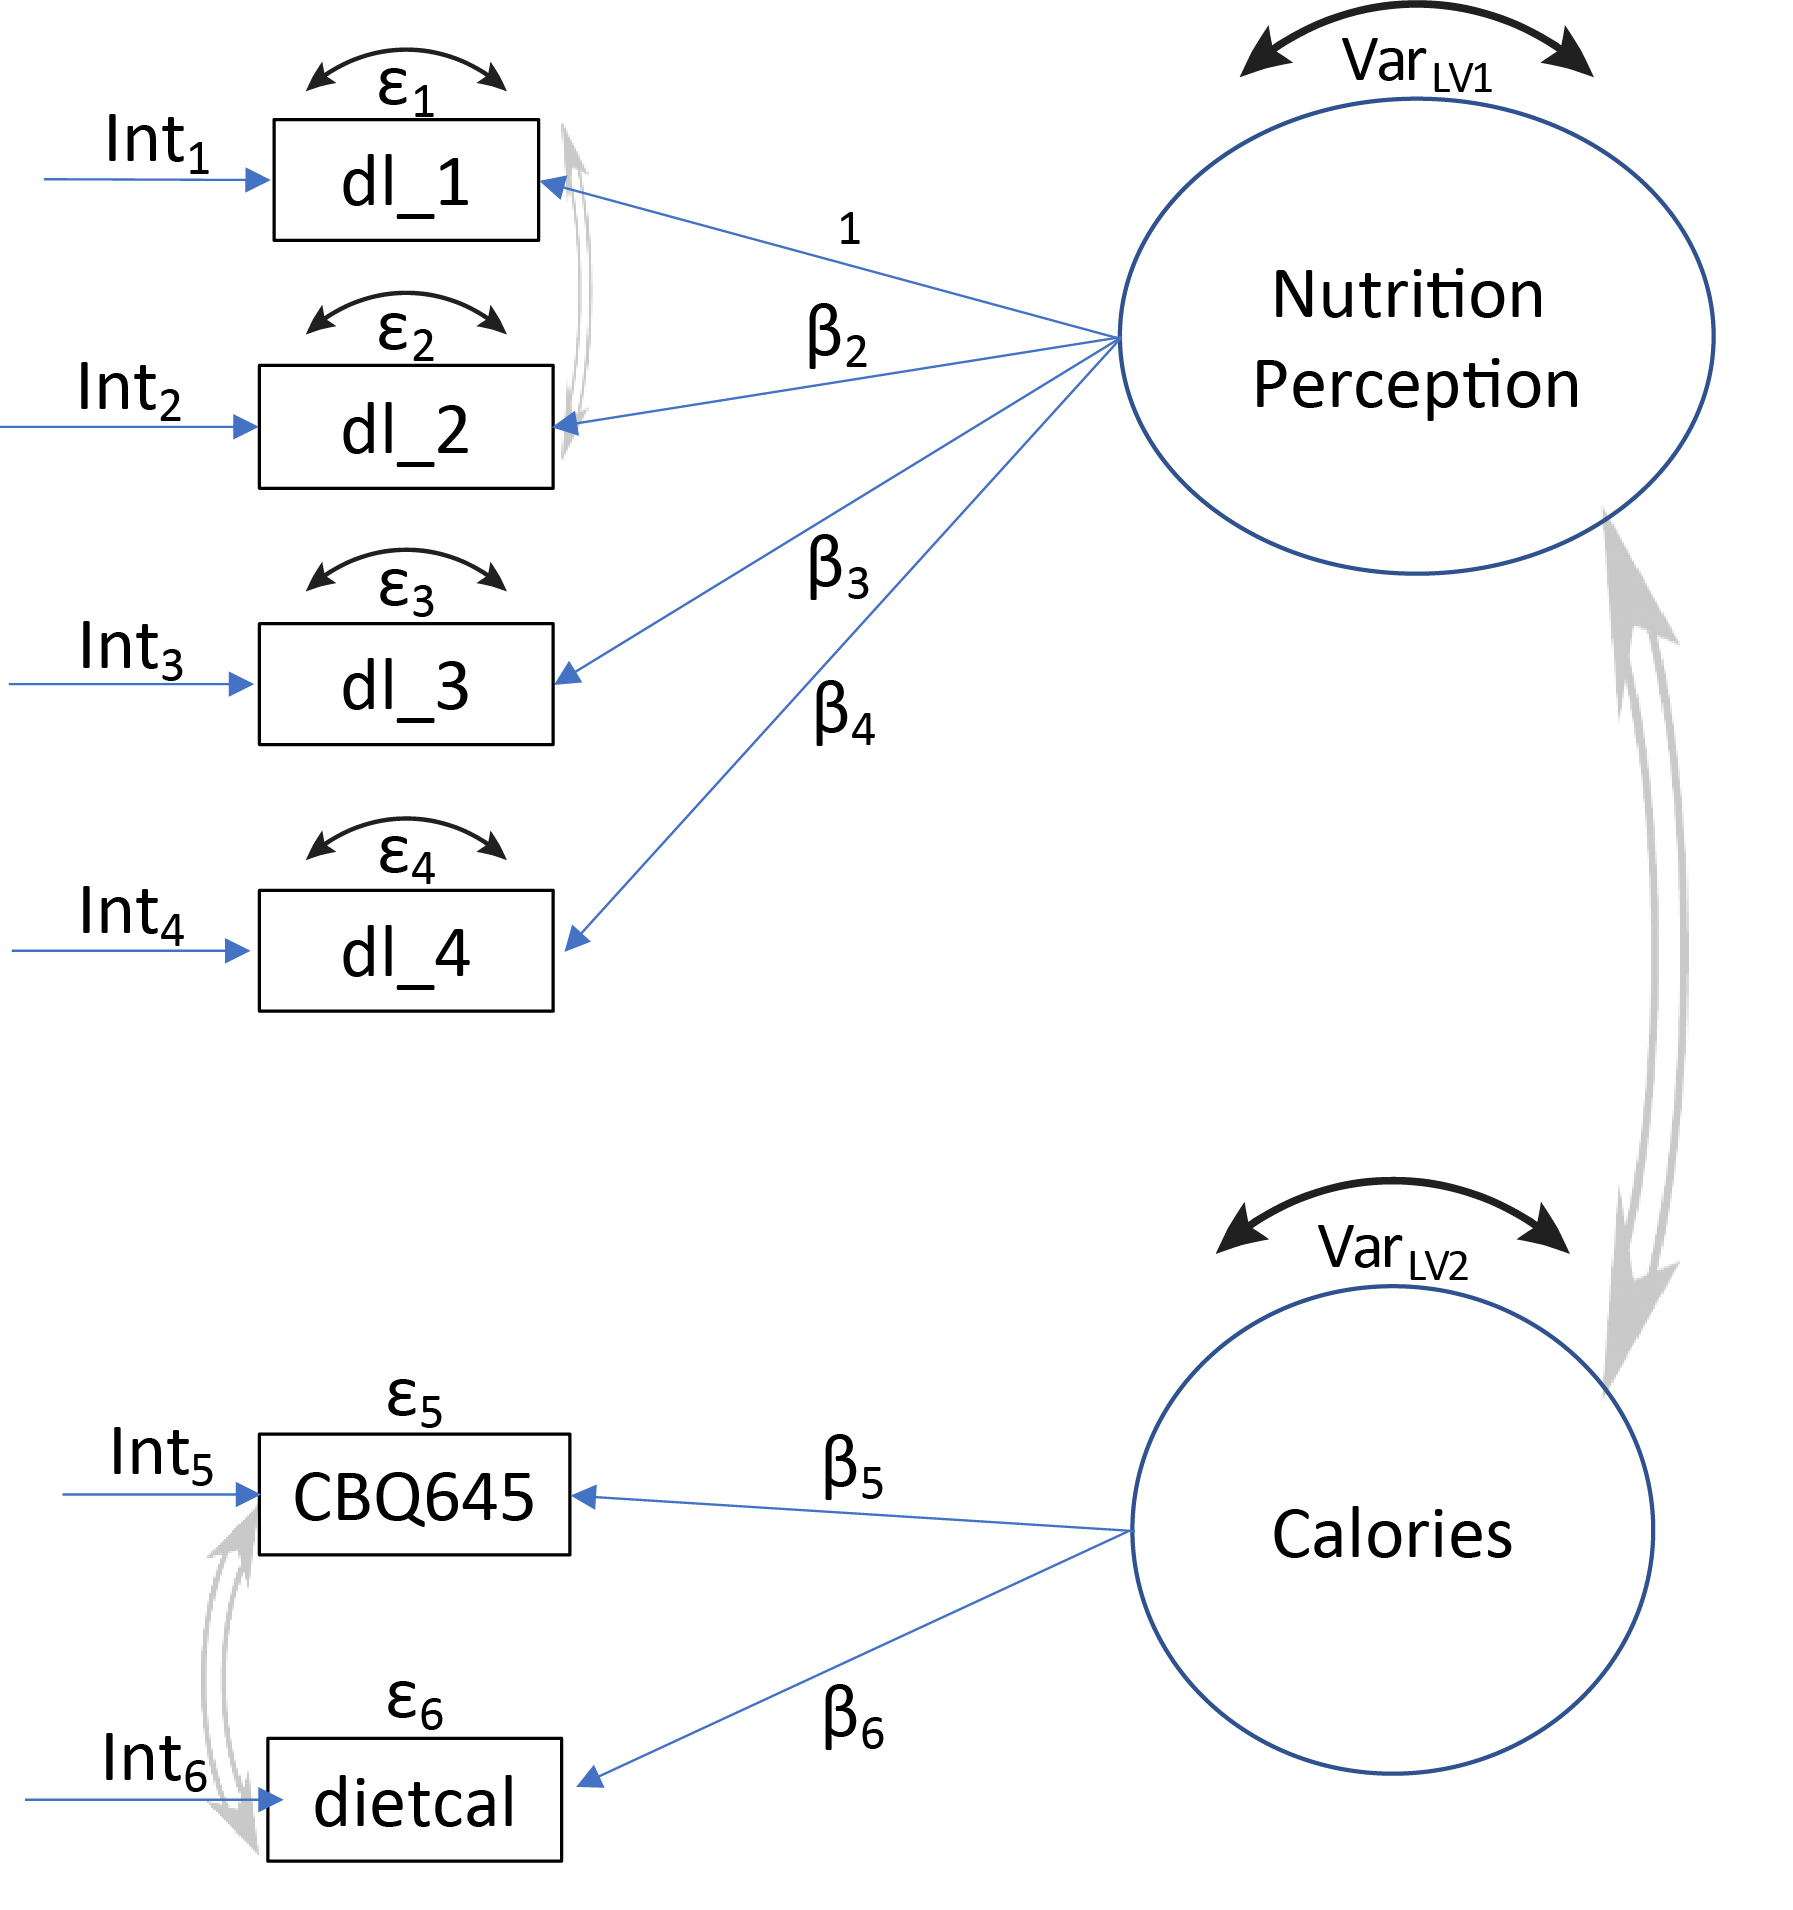
The manifest survey questions, measured on an ordinal or Likert-type scale, comprising the latent variables for each ME model, Food Safety Perception, Nutrition Awareness, and Food Handling Behavior are presented in Table 3. Figures 1, 2, and 3 illustrate the theoretical constructs of the three ME models. Most latent variables are represented by at least three survey questions. Further details regarding the inclusion of survey questions are in the Supplemental Material (S.2.3).

Figure 1
Figure 1.Measurement model for Food Safety Perception.

Square boxes are observed survey questions, circles are latent variables, (β) are the factor loadings and represent the strength of the relationship between the latent variable and the observed question, (Int) are the intercepts and represent the conditional mean of the observed question when the latent variable is 0, ε is the residual variance and represents reliability, and double-headed single-lined black arrows are residual variances. Each survey question was also regressed on the propensity scores (PS), but to avoid cluttering the plot, the PS regressions are not explicitly plotted. A blow-up example for one of the items is shown.
Covariances between latent variables were assumed and covariances between observed questions, which were suggested either by the context of the questions or by the fit of the model, were included. The covariances are drawn with double-headed double-lined gray arrows.

Figure 2
Figure 2.Measurement model for Nutrition Awareness.

Note: Although the latent variable ‘Calories’ is represented by only two items (only two calorie-specific questions were posed to the respondents), which may result in unstable estimates, the model fit was sufficiently good to proceed with our proposed models (Hemphill 2003).

Figure 3
Figure 3.Measurement model for Food Handling Behavior.

Note: Although the latent variable ‘Hand Washing’ is represented by only two items (only two handwashing questions were posed to the respondents), which may result in unstable estimates, the model fit was sufficiently good to proceed with our proposed models (Hemphill 2003).

MGCFA was implemented using the cfa function in the R lavaan package (Rosseel 2012). Only complete cases (i.e., Blank/Refused excluded) were included in the ME models. Yoon and Lai (2018) indicate that the power to detect a violation of invariance decreases as the ratio of the mode sample sizes increases. The ABS web survey had 1,374 food safety and 1,393 nutrition cases; the ABS paper had 853 food safety cases and 778 nutrition cases; and the RDD survey had 415 food safety and 419 nutrition cases. To overcome this unbalance, a subsampling procedure was employed. One hundred bootstrap samples of size 415 for the Food Safety Perception and Food Handling Behavior ME models and 419 for the Nutrition ME model were randomly chosen from the ABS-web and ABS-paper data frames and the measurement equivalence analysis was run using each of these 100 subsamples and the full RDD sample (Yoon and Lai 2018). Measures of fit (CFI, RMSEA) were calculated for each of the 100 runs and their means and percentile-based 95% confidence intervals (2.5th percentile, 97.5th percentile) were then calculated across the 100 runs. The 100 SBSD test p-values were adjusted for multiplicity using the Bonferroni adjustment and the p.adjust function in the R stats package (R Core Team 2019), and the percentage of non-significant p-values (pBonferroni>.05) was calculated.

Results: Latent factor variance invariance, the highest form of mode equivalence, was established for the Food Safety and Food Handling models, and partial scalar invariance, the third highest form of mode equivalence, was established for the Nutrition model (Table 5a). The inability to establish strict scaler equivalence for the Nutrition model, suggests difference(s) in variances (precision) of the manifest variables across mode. Table 5b presents the coefficients of variation for the questions comprising the Nutrition model. In general, ABS-paper, and to a lesser extent ABS-web, had higher coefficients of variation than RDD.

Table 3.Survey questions included in mode measurement equivalence, straightlining, acquiescence, and social desirability bias analyses..
Observed Question Variable Name ABS Scoring RDD Scoring Included in Analysis for
Question Stem
(if matrix question)
Question Item Mode Measurement Equivalence Straightlining Social Desirability Acquiescence
Latent Variable ME Model
How likely do you think it is that the following foods contain bacteria or other germs that could make people sick? Raw chicken A5a 1 = Don't know
2 = Not at all likely
3 = 2
4 = 3
5 = 4
6 = Very likely
Same as ABS scoring Specific Food
(risk perceptions about specific foods)
Food Safety Perception Battery Group 1
Raw eggs A5Dv1
Raw vegetables A5Ev1
Raw shellfish A5Fv1
Raw beef A5bV1
Raw fish A5Gv1
Raw fruit A5Cv1
How likely are you to get sick if you ate food that was handled in each of the following ways? If you forget to wash your hands before you begin cooking. F10A 1 = Not at all likely
2 = 2
3 = 3
4 = 4
5 = Very likely
Same as ABS scoring Behavior
(perception about risk-related behaviors hand washing & cooking)
Battery Group 2 Battery Group 2
If you eat raw vegetables that touched raw chicken. F10B
If you eat chicken that is not thoroughly cooked. F10C
If you eat chicken that was left at room temperature for more than 2 hours after it was cooked. F10D
How common do you think it is for people in the United States to get food poisoning because of… the way food is prepared in their home? A1 1 = Not very common
2 = Somewhat common
3 = Very common
Same as ABS scoring General
(perception about general foodborne illness risks)
Battery Group 3
the way food is prepared at restaurants? A2
food being contaminated with bacteria? A4
How strongly do you disagree or agree with each of the following statements? If I eat a healthy diet I can reduce my chance of getting heart disease. dl_1 1 = Don't know^
2 = Strongly disagree
3 = Somewhat disagree
4 = Neither agree nor disagree^
5 = Somewhat agree
6 = Strongly agree
Same as ABS scoring Healthy Diet Nutrition Awareness Battery Group 4 Battery Group 4 Battery Group 4
If I eat a healthy diet I can reduce my chance of getting cancer. dl_2
I am confident that I know how to choose healthy foods. dl_3
Eating a healthy diet is important for my long-term health. dl_4
Thinking about yourself, about how many calories do you need to consume in a day to maintain your current weight? CBQ645 1 = Don’t know
2 = Less than 1000 calories, More than 3000 calories
3 = 1000 – 3000 calories
Same as ABS scoring Calories
(caloric intake)
CBQ645
In general, do you think that you consume too few, too many, or about the right amount of calories? dietcal 1 = Don't know
2 = Too few/many calories
3 = About the right amount of calories
Same as ABS scoring dietcal
Before you begin preparing food, how often do you wash your hands with soap? D4 1 = Rarely 2 = Some of the time 3 = Most of the time 4 = All of the time Same as ABS scoring Hand Washing
(during food prep)
Food Handling Behavior D4
After you have cracked open raw eggs, what do you usually do? D11 1 = Continue cooking without washing hands
2 = Rinse or wipe hands
3 = Wash hands with soap
4 = Never handle "Something else" recoded as missing, 1, 2, 3 or 4 depending on the text specification
1 = Continue cooking without washing hands
2 = Rinse or wipe hands
3 = Wash hands with soap
4 = Never handle or Do not prepare at beginning of the meal (raw meat/chicken/fish)
D11
Over the past 12 months, how often did you use a food thermometer to test for doneness when you prepare the following foods? Whole chickens or turkeys thermwholechicken 1 = Don't own/Don't know if have or use food thermometer / Never use food thermometer*
2 = Sometimes use food thermometer
3 = Often use food thermometer
4 = Always use food thermometer
5 = Didn't cook food in past 12 months
Same as ABS scoring Food Thermometer
(use during cooking)
Battery Group 5 Battery Group 5
Beef, lamb, or pork roasts H8a
Chicken parts such as breasts or legs H8b
Baked egg dishes such as quiche, custard, or bread pudding H8c
Hamburgers made from beef H8d
Have you heard of … Salmonella as a problem in food? F1 1 = No
2=Yes
Same as ABS scoring Battery Group 6 Battery Group 6
Listeria as a problem in food? F4
Campylobacter as a problem in food? F5
Norovirus as a problem in food? F6
E. coli as a problem in food? F7
How do you use calorie information when deciding what to order? Do you use it to… Do you ever use the calorie information on menus or menu boards to decide what to order? restcal_use 1 = No
2=Yes
Same as ABS scoring Battery Group 7 Battery Group 7
Avoid ordering high-calorie menu items. restcal_avoidhical
Avoid ordering something that would leave you hungry. restcal_avoidhungry
Decide on a smaller portion size. restcal_smallerp
Decide on a larger portion size. restcal_largerp
Order fewer items. restcal_feweritem
Order more items. restcal_moreitem
Share the meal with someone else. restcal_sharemeal
Save part of the meal for later. restcal_savemeal

* Blank/Refused (scored as 9) included in the straightlining analysis;
^ Excluded from acquiescence analysis. A battery group is a group of related or connected questions, such as matrix or grid questions.

Table 5a.Assessment of mode measurement equivalence (ME) models (assessed over 100 subsamples): Percent of non-significant (N.S.) Satorra-Bentler scaled chi-square difference (SBSD) tests, mean Comparative Fit Index (CFI), mean Root Mean Square Error of Approximation (RMSEA), drop in CFI and increase in RMSEA.
ME Model Level of equivalence % N.S. SBSD p-valuesa Mean CFI b Mean RMSEA c Drop in CFI d Increase in RMSEA e
Food Safety Perception configural 0.86 (.82, .90) 0.10 (.089, .11)
metric 0.80 0.84 (.81, .89) 0.097 (.086, .11) -0.02 -0.003
partial scalar 1.00 0.83 (.79, .88) 0.096 (.084, .11) -0.01 -0.001
strict scalar 0.96 0.82 (.78, .87) 0.092 (.082, .10) -0.01 -0.004
factor invariance 0.93 0.81 (.75, .86) 0.094 (.083, .11) -0.01 0.002
Nutrition Awareness configural 0.94 (.90, .97) 0.089 (.066, .12)
metric 0.98 0.93 (.89, .96) 0.081 (.062, .10) -0.01 -0.008
partial scalar 0.94 0.92 (.87, .96) 0.081 (.063, .10) -0.01 0.000
strict scalar 0.67 0.86 (.78, .93) 0.096 (.070, .12) -0.06 0.015
factor invariance 0.01 0.75 (.65, .83) 0.13 (.11, .15) -0.11 0.034
Food Handling Behavior configural 0.98 (.97, .99) .053 (.033, .072)
metric 0.92 0.98 (.96, 1.00) .049 (.027, .072) 0.00 -0.004
partial scalar 0.77 0.97 (.95, .99) .056 (.040, .074) -0.01 0.007
strict scalar 0.89 0.97 (.94, .99) .056 (.038, .073) 0.00 0.000
factor invariance 0.80 0.96 (.94, .98) .059 (.041, .077) -0.01 0.003

a percent of nonsignificant SBSD tests; b average CFIs (95% CI); c average RMSEAs (95% CI); d drop in average CFI from previous equivalence level; e increase in average RMSEA from previous equivalence level.
Equivalence level established if % N.S. p-values >.8, drop in CFI ≤ .01, increase in RMSEA ≤.015, CFI>.90, RMSEA<.08. Greater importance placed on % N.S. p-values.
Full-sample model fits: for all models, p-values for SBSD: <0.0001. Hence, the theoretical SEM constructs are appropriate.
Although the Food Safety CFI of .81 is less than the criterion of .90, the upper 95% bound of .86 was close enough to .9, and the additional criteria of SBSD nonsignificance and low RMSEA were deemed sufficient to establish factor invariance.

Table 5b.Coefficients of variation (95% CI) of observed questions for Nutrition ME model (full sample).
Question Latent variable RDD ABS-web ABS-paper
dl_1 Healthy Diet 17.6 (16.5, 19) 20.9 (20.1, 21.7)* 24.2 (23.0,25.6)*
dl_2 26.2 (24.4, 28.2) 26.5 (25.5, 27.6) 31.3 (29.7, 33.2)*
dl_3 17.6 (16.5, 19.0) 20.7 (19.9, 21.5) 23.9 (22.7, 25.3)*
dl_4 14.5 (13.6, 15.6) 19.2 (18.5, 20.0)* 22.1 (21.0, 23.4)*
CBQ645 Calories 31.6 (29.5, 34.2) 28.1 (27.0, 29.2)* 34.6 (32.7, 36.6)
dietcal 24.0 (22.4, 25.8) 26.3 (25.3, 27.4) 30.5 (29.0, 32.2)*

Confidence intervals calculated using the Kelley method (Kelley 2021) and implemented using the cv_versatile function in the R cvcpv package (Beigy 2019). Nonoverlapping 95% confidence intervals indicate significant differences in variability from RDD (denoted by *).

3.3. Straightlining

Methods “Respondents who take “mental shortcuts,” are said to “satisfice,” by which it is meant that they do not (properly) perform all the necessary cognitive steps to answer a survey question” (Heerwegh and Loosveldt 2011). As shown in Table 1, one indicator of satisficing associated with speeding through grid or matrix questions on a self-administered survey is straightlining (Zhang and Conrad 2014). Low within-respondent variability may be a measure of low data quality in the form of straightlining and can be used to assess how attentively a respondent answered the survey (Cernat and Revilla 2020). Straightlining was assessed via the Standard Deviation of Battery Method (SDBM) (Kim et al. 2019). SDBM was calculated for each respondent by “battery group,” which are groups of related or connected questions, such as matrix or grid questions (Table 3). Linear regression was performed to assess the effect of mode on SDBM, while adjusting for covariates gender, race, age, education, income and urbanicity and adjusted means were compared across mode using two-tailed t-tests, for each battery group. Ninety-five percent confidence intervals were also calculated around the adjusted SDBM means assuming normality.

SDBMg=αg+βgX+εwhere g is the battery group, g=1,2,...7

Results: ABS-web and ABS-paper respondents had a greater tendency to straightline (i.e., lower SDBM) than RDD respondents for battery group 6 only (pweb =.0007, ppaper =.0006) (Table 6). This can most likely be explained by the way the questions were presented. The RDD survey posed each question in battery 6, “Have you heard of…,” individually for each pathogen, whereas the ABS survey posed one mark-all-that-apply question with a check box for each pathogen.

Table 6.Results of straightlining (Standard Deviation of Battery Method [SDBM]), acquiescence, social desirability bias and visual display bias analyses, comparing modes RDD, ABS-web and ABS-paper.
Battery Group^ Straightlining Acquiescence& Social Desirability Bias &
Adjusted mean SDBM (95% CI) Adjusted mean acquiescence (95% CI) Adjusted mean (95% CI)
RDD ABS-web ABS-paper RDD ABS-web ABS-paper RDD ABS-web ABS-paper
1 1.4 (1.3, 1.5) 1.5 (1.4, 1.5) 1.5 (1.4, 1.6) N/A N/A
2 1 (0.9, 1.1) 1 (0.9, 1.1) 1 (0.9, 1.1) N/A 3.7 (3.5, 3.8) 3.9 (3.8, 4.0)** 3.7 (3.6, 3.9)
3 0.5 (0.4, 0.6) 0.4 (0.4, 0.5) 0.4 (0.4, 0.5) N/A
4 0.6 (0.5, 0.7) 0.7 (0.6, 0.7) 0.7 (0.6, 0.8) 5.6 (5.5, 5.7) 5.3 (5.2, 5.4)*** 5.2 (5.1, 5.4)*** 5.5 (5.4, 5.6) 5.1 (5.0, 5.2)*** 5.1 (4.9, 5.2)***
5 0.6 (0.5, 0.7) 0.6 (0.5, 0.7) 0.5 (0.4, 0.6) N/A 1.7 (1.6, 1.9) 1.9 (1.8, 2.0)* 1.7 (1.6, 1.8)
6 0.8 (0.6, 0.9) 0.5 (0.5, 0.6)** 0.5 (0.5, 0.6)** 1.6 (1.6, 1.6) 1.5 (1.5, 1.5)*** 1.5 (1.4, 1.5)*** N/A
7 0.9 (0.8, 1.1) 0.9 (0.8, 1) 1 (0.9, 1.2) 1.3 (1.3, 1.4) 1.2 (1.2, 1.2)*** 1.2 (1.1, 1.2)***
Non-Battery questions
D4 N/A N/A 3.7 (3.6, 3.8) 3.7 (3.6, 3.7) 3.7 (3.6, 3.8)
D11 2.2 (2.1, 2.3) 2.3 (2.2, 2.3) 2.2 (2.2, 2.3)
CBQ645 2.4 (2.3, 2.6) 2.4 (2.3, 2.5) 2.3 (2.2, 2.4)
dietcal 2.4 (2.3, 2.5) 2.3 (2.2, 2.3)** 2.2 (2.1, 2.3)***

N/A, Did not meet criteria for inclusion in analysis; ^ Please refer to Table 3 for questions included in each battery group.
& Blank/Refused excluded for acquiescence and social desirability bias. Don’t know/Neither agree nor disagree further excluded from acquiescence bias.
Higher SDBM adjusted means lower straightlining tendency; higher adjusted means equate to higher acquiescence and higher social desirability.
95% confidence intervals were calculated around the adjusted means assuming normality.
Significant difference from RDD: * p<.05, ** p<.01, *** p<.0001. Acquiescence and social desirability: 1-tailed t-test: (i.e., Ha1: µRDD> µABS-web, Ha2: µRDD> µABS-paper); Straightlining: 2-tailed t-test.

3.4. Acquiescence and Social Desirability Bias

Methods Acquiescence is the tendency of a respondent to select the “yes” or “agree” option regardless of the content of the question or topic (Heerwegh and Loosveldt 2011). Social desirability is the tendency of respondents to overstate positive behaviors and understate negative ones (Andersen and Mayerl 2017). In the context of the FSANS questions, the socially desirable responses were those corresponding to higher levels of knowledge regarding healthful eating or safe food handling practices. Questions were coded or re-coded such that higher scores represented higher acquiescence and higher social desirability (Table 3).

The hypothesis that RDD (interviewer-administered) fostered higher acquiescence than ABS (self-administered) was assessed by calculating the acquiescence for “battery groups” of questions with either a “yes/no” or on a Likert agree scale, namely battery groups 4, 6 and 7 (Table 3) (Kim et al. 2019). “Don’t know,” blanks, “Neither agree nor disagree,” and “Refused” (RDD only) were excluded from the analysis as they are not informative of acquiescence in any direction. Social desirability bias was assessed on battery groups 2, 4, and 5, and non-battery questions CBQ645, dietcal (self-reported calorie consumption, Table 3), D4 and D11.

To assess if RDD respondents presented higher acquiescence or social desirability bias, the average score (value) for each battery group or question was linearly regressed on mode. Because acquiescence or social desirability may be related to respondent characteristics (Heerwegh and Loosveldt 2011), gender, age, race, education, income, and urbanicity were included as covariates in the model.

Results: As hypothesized, RDD fostered higher acquiescence than ABS web and paper (Table 6). RDD also fostered greater social desirability than ABS for battery group 4, the battery comprising the latent variable Healthy Diet, and dietcal.

4. DISCUSSION AND CONCLUSION

To maintain survey quality, many probability-based surveys, including the FDA Food Safety and Nutrition Survey (FSANS), have transitioned from RDD to ABS methodology. Using the 2019 FSANS survey, this paper provides a thorough cross-mode analytical comparison of sampling and measurement biases between the RDD and ABS (web and paper) modes and serves as a guide to survey researchers, seeking to transition survey modes .

The most notable difference between the RDD and ABS sample compositions is home ownership, with the ABS sample comprised of significantly more homeowners than the RDD sample. Since the early 1990s, renters have been much less likely than homeowners to complete mailed Census questionnaires (Word 1997). The ABS paper option was included to encourage renters to respond to the survey, but they were still underrepresented, suggesting that other strategies to oversample or recruit renters may be warranted in future ABS surveys.

Overall, the transition between RDD and ABS was successful. Latent factor variance equivalence, the highest level of mode measurement equivalence examined, was established for the Food Safety and Food Handling models and partial scalar equivalence was established for the Nutrition Awareness model. This demonstrates that these questions were successfully transitioned from an interview administered telephone mode to a self-administered written survey without changing the meaning of the questions or underlying theoretical concepts the questions were measuring.

As expected, there were some minor differences in mode measurement bias between the RDD and ABS survey modes. Consistent with the literature, RDD respondents were more likely to acquiesce and for one group of questions related to Healthy Diet, RDD respondents were also more likely to provide socially desirable answers (Heerwegh and Loosveldt 2011). We hypothesize that for the Healthy Diet questions, the RDD acquiescence bias and the social desirability bias likely worked in conjunction to contribute to the lower variability observed in the RDD ME Nutrition Awareness model, for which only partial scalar equivalence was established.

The many data quality checks that were implemented before and during data collection, including writing questions in as neutral a manner as possible, conducting cognitive tests of the survey instruments, pretesting all data collection methods, and removing respondents who sped through the survey were helpful in achieving mode equivalence.

Finally, in situations where data cycles differ by survey administration mode and bias(s) is(are) found, a trend analysis may still be conducted as long as remedial actions are taken. One action is to include the cycle or survey mode as an indicator variable in predictive models in order to compare variables of interest after adjusting for mode (i.e., Type 3 or Partial analyses). Another action, in cases where strict scalar or latent factor variance equivalence is not established, i.e., the modes have different precision or variability, survey sampling weights can be further adjusted by giving greater weight to the survey mode with higher precision.

If mode equivalence is not established and remedial actions are not implemented, proceeding with a trend analysis may lead to finding differences over time which are not true differences (i.e., false significance) but are instead due to mode invariance. For example, if a mode exhibits greater precision (as in RDD for the FSANS Nutrition awareness questions), differences may be found due to non-homogeneity of variances (heteroskedasticity) and not true differences in means (Frost 2017).

While there were some minor imbalances between the two survey modes, we find that the FSANS RDD telephone and ABS web and paper modes are acceptably equivalent to justify the transition from RDD to ABS and to maintain continuity in tracking trends over time. Our findings highlight the importance of comprehensively assessing survey biases, so that researchers can feel confident about the overall success of the survey transition while also pinpointing specific questions (or topics) that may require additional work before making trends comparisons. Additionally, for researchers planning new surveys, our findings suggest that ABS web and paper surveys offer many advantages over RDD phone surveys, such as higher response rates and lower tendencies for acquiescence.


Funding

The authors are with the Office of Analytics and Outreach, Center for Food Safety and Applied Nutrition, US Food and Drug Administration. This work was funded by the U.S. Food and Drug Administration, Center for Food Safety and Applied Nutrition.

Acknowledgements

The authors want to thank Jennifer Berktold, PhD, Hyunshik Lee, PhD, Michael Jones, Jonathan Wivagg and supporting staff at Westat for their support during this project.

Submitted: February 14, 2022 EDT

Accepted: March 24, 2022 EDT

References

Andersen, Henrik, and Jochen Mayerl. 2017. “Social Desirability and Undesirability Effects on Survey Response Latencies.” Bulletin de méthodologie sociologique: BMS 135 (1): 68–89. https:/​/​doi.org/​10.1177/​0759106317710858.
Google Scholar
Barrett, Paul. 2007. “Structural Equation Modelling: Adjudging Model Fit.” Personality and Individual Differences 42 (5): 815–24. https:/​/​doi.org/​10.1016/​j.paid.2006.09.018.
Google Scholar
Beigy, M. 2019. cvcqv: Coefficient of Variation (CV) with Confidence Intervals (CI). R package version 1.0.0. https:/​/​CRAN.R-project.org/​package=cvcqv.
Google Scholar
Cernat, A., and M. Revilla. 2020. “Moving from Face-to-Face to a Web Panel: Impacts on Measurement Quality.” Journal of Survey Statistics and Methodology 0:1–19.
Google Scholar
Chen, Fang Fang. 2007. “Sensitivity of Goodness of Fit Indexes to Lack of Measurement Invariance.” Structural Equation Modeling: A Multidisciplinary Journal 14 (3): 464–504. https:/​/​doi.org/​10.1080/​10705510701301834.
Google Scholar
Couper, M. P. 2011. “The Future of Modes of Data Collection.” Public Opinion Quarterly 75 (5): 889–908. https:/​/​doi.org/​10.1093/​poq/​nfr046.
Google Scholar
DeMaio, T.J. 1984. “Social Desirability and Survey Measurement: A Review”.” In Surveying Subjective Phenomena, edited by C. Turner and E. Martin, 2:257–81. New York, NY: Russell Sage Foundation.
Google Scholar
Finney Rutten, L.J., T. Davis, E.B. Beckjord, K. Blake, R.P. Moser, and B.W. Hesse. 2012. “Picking Up the Pace: Changes in Method and Frame for the Health Information National Trends Survey (2011–2014).” Journal of Health Communication 17 (8): 979–89.
Google Scholar
Frost, Jim. 2017. “Heteroscedasticity in Regression Analysis.” Statistics by Jim. August 29, 2017. https:/​/​statisticsbyjim.com/​regression/​heteroscedasticity-regression.
Groves, R. M., and E. Peytcheva. 2008. “The Impact of Nonresponse Rates on Nonresponse Bias: A Meta-Analysis.” Public Opinion Quarterly 72 (2): 167–89. https:/​/​doi.org/​10.1093/​poq/​nfn011.
Google Scholar
Guterbock, Thomas M., Paul J. Lavrakas, Trevor N. Tompson, and Randal ZuWallack. 2011. “Cost and Productivity Ratios in Dual-Frame RDD Telephone Surveys.” Survey Practice 4 (2): 2011–20110008. https:/​/​doi.org/​10.29115/​sp-2011-0008.
Google Scholar
Heerwegh, D., and G. Loosveldt. 2011. “Assessing Mode Effects in a National Crime Victimization Survey Using Structural Equation Models: Social Desirability Bias and Acquiescence.” Journal of Official Statistics 27 (1): 49–63.
Google Scholar
Hemphill, James F. 2003. “Interpreting the Magnitudes of Correlation Coefficients.” American Psychologist 58 (1): 78–79. https:/​/​doi.org/​10.1037/​0003-066x.58.1.78.
Google Scholar
Horn, John L., and J. J. McArdle. 1992. “A Practical and Theoretical Guide to Measurement Invariance in Aging Research.” Experimental Aging Research 18 (3): 117–44. https:/​/​doi.org/​10.1080/​03610739208253916.
Google Scholar
Hox, Joop J., Edith D. De Leeuw, and Hsuan-Tzu Chang. 2012. “Nonresponse versus Measurement Error: Are Reluctant Respondents Worth Pursuing?” Bulletin de méthodologie sociologique: BMS 113 (1): 5–19. https:/​/​doi.org/​10.1177/​0759106311426987.
Google Scholar
Hox, Joop J., Edith D. De Leeuw, and Eva A. O. Zijlmans. 2015. “Measurement Equivalence in Mixed Mode Surveys.” Frontiers in Psychology 6 (87). https:/​/​doi.org/​10.3389/​fpsyg.2015.00087.
Google ScholarPubMed CentralPubMed
Hox, Joop J., Edith De Leeuw, and Thomas Klausch. 2017. “Mixed-Mode Research: Issues in Design and Analysis.” In Total Survey Error in Practice, 511–30. Hoboken, New Jersey: John Wiley & Sons, Inc. https:/​/​doi.org/​10.1002/​9781119041702.ch23.
Google Scholar
Kelley, K. 2021. MBESS: The MBESS R Package. R package version 4.8.1. https:/​/​CRAN.R-project.org/​package=MBESS.
Google Scholar
Kim, Yujin, Jennifer Dykema, John Stevenson, Penny Black, and D. Paul Moberg. 2019. “Straightlining: Overview of Measurement, Comparison of Indicators, and Effects in Mail–Web Mixed-Mode Surveys.” Social Science Computer Review 37 (2): 214–33. https:/​/​doi.org/​10.1177/​0894439317752406.
Google Scholar
Kreuter, F., S. Presser, and R. Tourangeau. 2008. “Social Desirability Bias in CATI, IVR, and Web Surveys: The Effects of Mode and Question Sensitivity.” Public Opinion Quarterly 72 (5): 847–65. https:/​/​doi.org/​10.1093/​poq/​nfn063.
Google Scholar
Krosnick, Jon A. 1991. “Response Strategies for Coping with the Cognitive Demands of Attitude Measures in Surveys.” Applied Cognitive Psychology 5 (3): 213–36. https:/​/​doi.org/​10.1002/​acp.2350050305.
Google Scholar
Link, Michael W., Michael P. Battaglia, Martin R. Frankel, Larry Osborn, and Ali H. Mokdad. 2006. “Address-Based versus Random-Digit-Dial Surveys: Comparison of Key Health and Risk Indicators.” American Journal of Epidemiology 164 (10): 1019–25. https:/​/​doi.org/​10.1093/​aje/​kwj310.
Google Scholar
———. 2008. “A Comparison of Address-Based Sampling (ABS) versus Random-Digit Dialing (RDD) for General Population Surveys.” Public Opinion Quarterly 72 (1): 6–27. https:/​/​doi.org/​10.1093/​poq/​nfn003.
Google Scholar
Martinez-Gomez, Monica, Juan A. Marin-Garcia, and Martha Giraldo O’Meara. 2017. “Testing Invariance between Web and Paper Students Satisfaction Surveys: A Case Study.” Intangible Capital 13 (5): 879. https:/​/​doi.org/​10.3926/​ic.1049.
Google Scholar
Peytchev, Andy, Jamie Ridenhour, and Karol Krotki. 2010. “Differences Between RDD Telephone and ABS Mail Survey Design: Coverage, Unit Nonresponse, and Measurement Error.” Journal of Health Communication 15 (sup3): 117–34. https:/​/​doi.org/​10.1080/​10810730.2010.525297.
Google Scholar
Pierannunzi, C., S. Gamble, R. Locke, N. Freedner, and M. Town. 2019. “Differences in Efficiencies Between ABS and RDD Samples by Mode of Data Collection.” Survey Practice 12 (1): 1–12.
Google Scholar
R Core Team. 2019. R: A language and environment for statistical computing. https:/​/​www.R-project.org/​.
Google Scholar
Rosseel, Y. 2012. “lavaan: An R package for structural equation modeling and more Version 0.5-12 (BETA).” Journal of Statistical Software 48 (2): 1–36.
Google Scholar
Satorra, A., and P.M. Bentlee. 2001. “A Scaled Difference Chi-Square Test Statistic for Moment Structure Analysis.” Psychometrika 66:507–14.
Google Scholar
Spreeuwenberg, Marieke Dingena, Anna Bartak, Marcel A. Croon, Jacques A. Hagenaars, Jan J. V. Busschbach, Helene Andrea, Jos Twisk, and Theo Stijnen. 2010. “The Multiple Propensity Score as Control for Bias in the Comparison of More than Two Treatment Arms: An Introduction from a Case Study in Mental Health.” Medical Care 48 (2): 166–74. https:/​/​doi.org/​10.1097/​mlr.0b013e3181c1328f.
Google Scholar
Sterrett, David, Dan Malato, Jennifer Benz, Trevor Tompson, and Ned English. 2017. “Assessing Changes in Coverage Bias of Web Surveys in the United States.” Public Opinion Quarterly 81 (S1): 338–56. https:/​/​doi.org/​10.1093/​poq/​nfx002.
Google Scholar
United States Census Bureau. n.d. “American Community Survey (ACS).” https:/​/​www.census.gov/​programs-surveys/​acs/​.
van de Schoot, Rens, Peter Lugtig, and Joop Hox. 2012. “A Checklist for Testing Measurement Invariance.” European Journal of Developmental Psychology 9 (4): 486–92. https:/​/​doi.org/​10.1080/​17405629.2012.686740.
Google Scholar
Wells, B.M. 2020. “CHIS Methodology Brief, Innovative Methods to Increase Child Interviews in the California Health Interview Survey.” UCLA Center for Health Policy Research.
Woodruff, R.S. 1971. “A Simple Method for Approximating the Variance of a Complicated Estimate.” Journal of the American Statistical Association 66:411–14.
Google Scholar
Word, D. 1997. “Who Responds/Who Doesn’t? Analyzing Variations in Mail Response Rates during the 1990 Census.” Population Division Working Paper No. 19 Series, U.S. Bureau of the Census.
Xu, K. 2012. Multiple Group Measurement Invariance Analysis in Lavaan. Department of Psychiatry, University of Cambridge. https:/​/​users.ugent.be/​~yrosseel/​lavaan/​multiplegroup6Dec2012.pdf.
Google Scholar
Yoon, Myeongsun, and Mark H. C. Lai. 2018. “Testing Factorial Invariance with Unbalanced Samples.” Structural Equation Modeling: A Multidisciplinary Journal 25 (2): 201–13. https:/​/​doi.org/​10.1080/​10705511.2017.1387859.
Google Scholar
Zhang, C., and F.G. Conrad. 2014. “Speeding in Web Surveys: The Tendency to Answer Very Fast and Its Association with Straightlining.” Survey Research Methods 8 (2): 127–35.
Google Scholar

This website uses cookies

We use cookies to enhance your experience and support COUNTER Metrics for transparent reporting of readership statistics. Cookie data is not sold to third parties or used for marketing purposes.

Powered by Scholastica, the modern academic journal management system