
Background
Methodological research has recognized the use of hypothetical questions as an effective means to investigate respondents’ attitudes toward survey participation and data collection to make assumptions about their behavior (Hargittai et al. 2020; Keusch et al. 2019; Olson, Smyth, and Wood 2012; Pinter 2015; Revilla, Couper, and Ochoa 2019; Wenz, Jäckle, and Couper 2019). This relationship between attitude and behavior is particularly important to decision makers because the intentions of stakeholders may be the only data available when looking to implement new policies or protocols. For example, the U.S. Department of Health and Human Services Centers for Disease Control and Prevention’s COVID-19 Rapid Community Assessment Guide (2021) includes, “How likely are you to get a COVID-19 vaccine?”.
Although this example is an important indicator of intention during the COVID-19 pandemic, research on hypothetical questions has identified several risks to response accuracy including social desirability bias (Norwood and Lusk 2011), the length of consideration (Cook et al. 2012) or the framing of consequence associated with the response (Carson and Groves 2007; Howard et al. 2017). But perhaps the most critical influences are task familiarity and context (Keusch et al. 2019; Schläpfer and Fischhoff 2012; Struminskaya et al. 2020). Yet, even if these factors are (mostly) controlled, it is still challenging to establish a link between an attitude, expressed as an intention at and a behavior observed at
Often it is necessary to make a reasoned assumption about the alignment of an individual’s attitudes and behaviors. By identifying a given attitude, and the likelihood that the attitude will contribute to a particular behavioral outcome, researchers can establish a measure of the respondent’s intention (Bradburn, Sudman, and Wansink 2004, ch 4). For example, Keusch et al. (2019) presented participants with multiple hypothetical research studies involving passive data collection through a smartphone app and then asked their attitudes toward participating in each study. Based on the participants’ responses, they assume under what conditions participants would cooperate. More recently, research has focused on respondents’ attitudes toward downloading hypothetical COVID-19 tracking applications (Hargittai et al. 2020). These studies employ intention as a metric for behavioral outcomes by assuming attitudes and behaviors are congruent.
In this paper, we discuss results from an experiment that found significant response bias to hypothetical questions even when the hypothetical context was unambiguous and included salient properties which were familiar to respondents from prior experience. Specifically, some members of a longitudinal panel survey were surveyed using the standard version of the questionnaire that they were used to, while an experimental group received the traditional survey with slight alterations to the presentation of the questions. Upon completion of the survey, all respondents were asked to respond to several attitudes questions in a debriefing section, which we call respondent experience questions (REQs).
For all but ten REQs, the question wording was identical for all respondents and assessed respondent attitudes toward the survey (e.g., perceived speed and enjoyment). The remaining ten questions were dependent on group assignment and asked how the respondent either felt, or would have felt (i.e., hypothetically), about the modified survey format. Because the experimental format was a change to a salient survey feature and all respondents were equally familiar with the standard survey format from prior rounds, we expect any group differences in the ten conditional REQs to be indicative of response bias between respondents who reported their hypothetical attitudes versus those who reported their attitude based on experience.
Data/Design
The Survey of Doctorate Recipients (SDR), conducted by the National Center for Science and Engineering Statistics (NCSES), is a fixed-panel, longitudinal survey of doctorate recipients in science and engineering fields. The SDR covers recent employment, past employment, and related experiences such as training and educational experiences. The 2019 SDR sample included 120,000 cases and concluded with 80,882 respondents participating (AAPOR RR3 = 67.4%). The SDR has shown a notable trend toward completion via the Web (84% in 2017 and 93% in 2019). With an increasing proportion of the sample completing via a self-administered Web instrument, an experiment was fielded to test a Web-administered, dependent interviewing approach.
Dependent interviewing is the process of reiterating a respondent’s prior survey responses during subsequent rounds of data collection and is common in panel surveys (Jäckle 2006). Dependent interviewing can reduce measurement error by reducing burden, aiding memory/recall, and providing panel participants continuity over the course of their enrollment (Pascale and Mayer 2004). The experiment was designed to test these advantages and capture respondents’ attitudes toward the use of dependent interviewing.
The SDR pilot design used a stratified systematic random sample of 3,900 eligible respondents. 3,600 cases were selected from 2019 SDR respondents with an additional 300 cases that last participated in either 2015 or 2017. The sampled cases were randomly and evenly distributed into three experimental groups resulting in 1,300 sample cases for each group. The Control group (CTR) received the traditional (i.e., cross-sectional) version of the survey, and two types of dependent interviewing protocols (collectively called TRT) were tested in parallel. Minimal changes were made to the instrument in order to accommodate the dependent interviewing protocol and examples of survey questions for each condition can be found in Appendix A (supplement online). Our analysis focuses specifically on responses to the ten REQs introduced previously, and the differences observed between the attitudes reported by the CTR to the hypothetical modification and attitudes of the TRT who experienced the modification.
Respondent Experience Questions (REQs)
The REQ portion of the questionnaire was similar to a debriefing survey. All respondents were asked several identical questions about their experience with the survey; however, ten conditional questions were altered by group. The TRT respondents were asked direct questions about their experience, such as, “Do you think that pre-filling some of your answers from <PRIOR CYCLE> and asking you to confirm or update them made this survey… Much more burdensome, A little more burdensome, Neither more or less burdensome, A little less burdensome, Much less burdensome.” Members of the CTR group were asked a hypothetically equivalent question, i.e., “If this survey had pre-filled your most recent answers and asked you to confirm or update them, would that have made this survey…” followed by the same set of response options available to the TRT group.
The first seven questions, which we call reaction questions, asked respondents to indicate the strength of their reaction (annoyed, appreciative, comfortable, concerned, confused, surprised, and relieved) to the experienced/hypothetical protocol using the response options: “Not at all,” “A little,” or “Very much.” The order of these seven questions was randomized for all respondents. The remaining three REQs, which we call efficacy (of TRT) questions, asked whether respondents felt the protocol would have a positive or negative influence on response accuracy or survey burden as well as whether pre-filling the most recent SDR responses would be a “good or bad idea” for future rounds of the survey. Missing responses were comparable across conditions and all ten of our selected REQs achieved response rates of 95% or higher. See Appendix B (supplement online) for screen shots of the respondent experience questions analyzed for both groups.
Methods
As mentioned previously, there were originally two variations of the dependent interviewing protocol. However, for the analyses reported, no statistically significant differences were found between the responses of the two treatment groups. Therefore, we combine both treatments into one TRT group for all presented analyses. Using the CTR and combined TRT, we begin by confirming the conditional dependence of responses on experimental condition by calculating Pearson’s for the responses to each REQ. We also calculate effect size in the form of odds ratios for each response category. Lastly, we converted the ordinal response categories to discrete numeric values and examined the difference in mean response values by calculating t-tests.
Since the categories for the reaction REQs represented ordinal but asymmetric intervals, we used the values: 0 = “not at all,” 1 = “a little,” and 3 = “very much.” The three efficacy questions were recoded using bipolar scales. The impact on accuracy was coded as: -1 = “less accurate,” 0 = “no impact,” 1 = “more accurate.” Due to the sparsity of some responses, the effect on burden and whether the protocol was a good or bad idea were both collapsed to a three-point scale ranging from -1 to 1, respective of the negative, neutral, and positive response options. All analyses were conducted in R (version 4.1.2, 2021). All findings below result from the analysis of the unweighted data.
Results
The mosaic plots in Figure 1 illustrate the X2 results by displaying area-proportional distributions using residual-based shading corresponding to the maximum X2 statistic. The cut-off points and indicate that the corresponding cells are those with individual residuals significant and respectively. (Negative values for residuals are indicated by dotted outlines.) Response distributions trended in the same direction across groups; however, the CTR consistently exhibited more critical attitudes than the TRT. For example, we see that when the question is negative, such as the level of annoyance (Figure 1 top left), responses of “not at all” are most frequent, but the proportion of the CTR reporting “not at all” is smaller than the proportion of the TRT. Conversely, when the question is positive, for example the level of reported appreciation (Figure 1 top center), we see “very much” is the most frequent response but again, the proportion of the CTR reporting “very much” is smaller than the proportion of the TRT reporting the same.
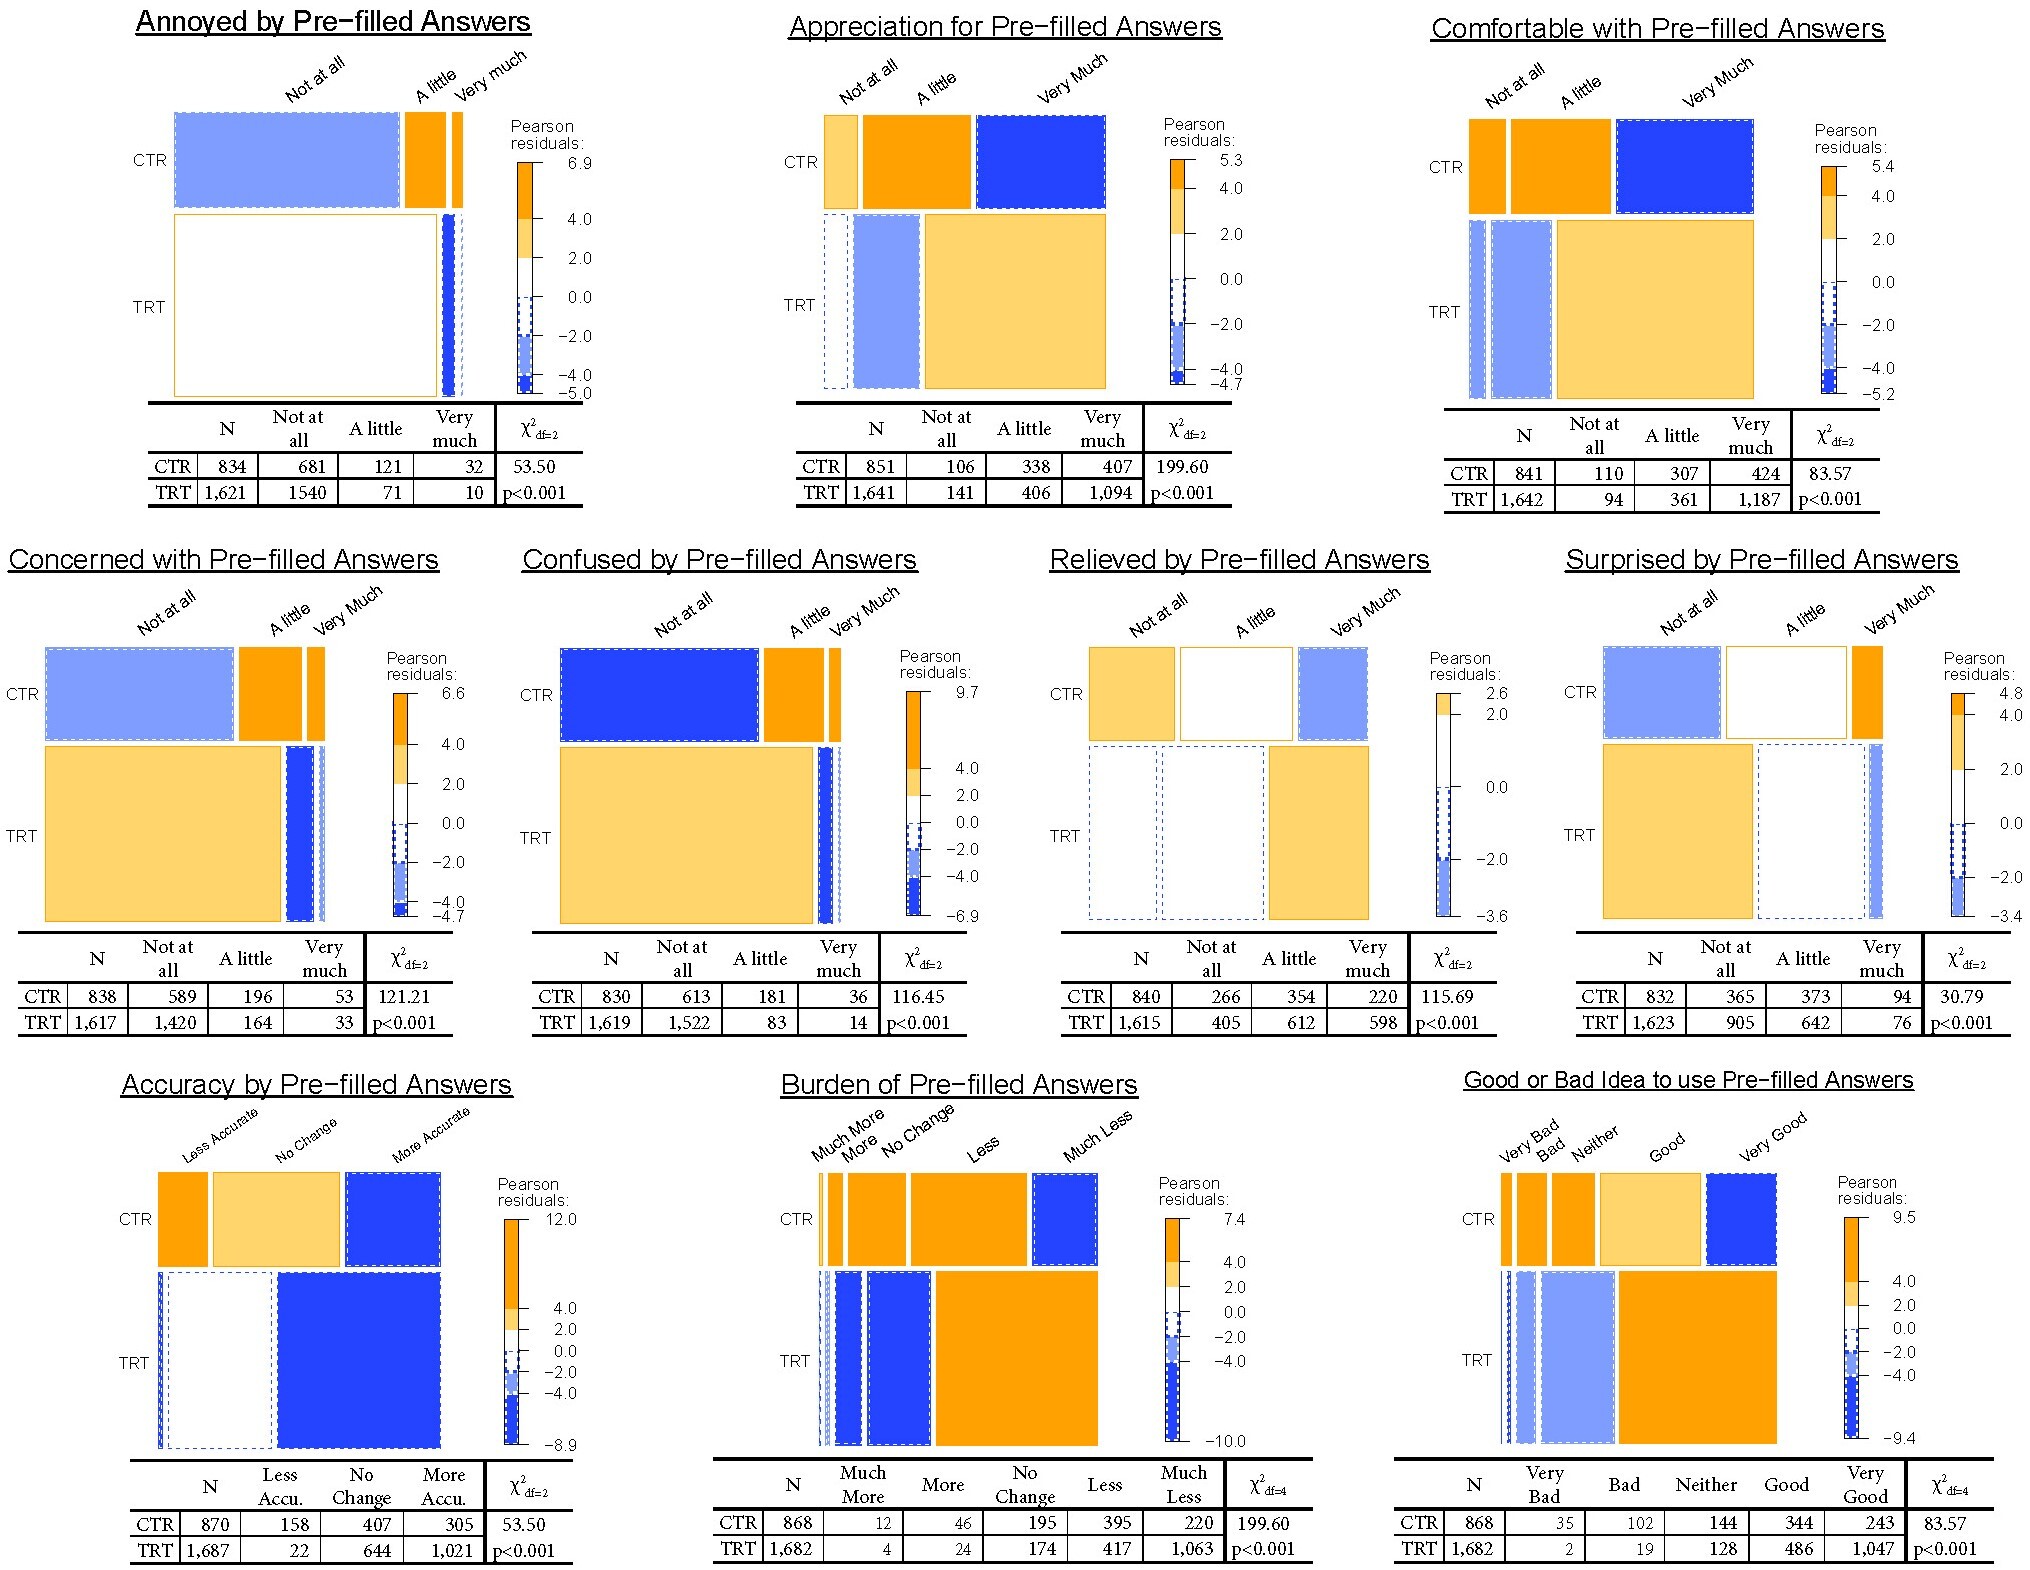
The mosaic plot of the level of reported comfort (Figure 1 top right) shows only 50% CTR participants reported they would be very comfortable seeing their answers pre-filled; a rate we would expect less than 0.01% of the time if the conditions were independent. Comparatively, we see that 72% of the TRT reported being very comfortable with seeing their prior responses pre-filled; a rate that would be expected less than 5% of the time if the conditions were truly independent. Χ2 tests of independence of the responses across groups indicate significant associations (p<0.001 for all questions) with
The odds ratios of the conditional probabilities for each response further illustrate how significantly the opinions of the TRT deviate from the opinions of the CTR. In Table 1, we see that across almost all questions, the TRT is more than twice as likely as the CTR to report positive reactions. The TRT was more than four times as likely than the CTR to express no annoyance at all, over three times as likely to express no concern at all, and over five times as likely to report no confusion at all. In reporting positive reactions, the TRT was twice as likely to report being very appreciative and they were two and a half times as likely to report being very comfortable. We find a similar and starker pattern among responses to the efficacy questions with the TRT being less likely to report a negative or neutral response to all questions and far more likely to respond positively. Across all estimated odds ratios, p-values were significant, rising above 0.01 in only two comparisons (i.e., a little relieved and a little surprised).
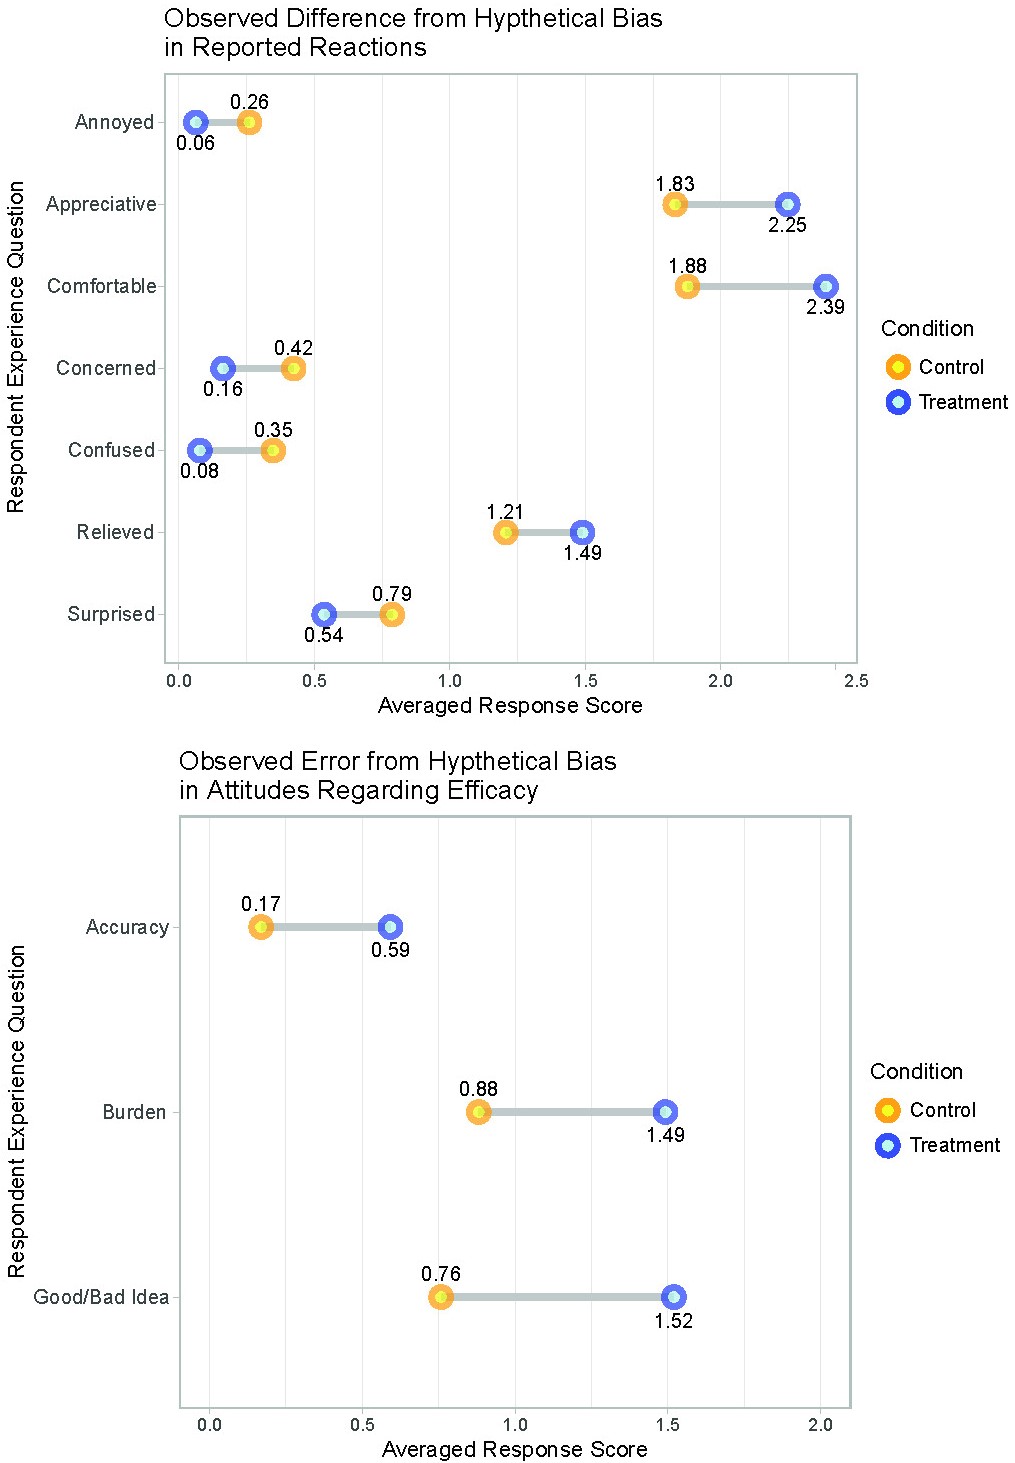
Using the discrete values noted in the “Methods” section, we found that t-tests comparing group means similarly resulted in significant associations between the conditions and responses. Figure 2 illustrates the difference in the mean response values for each condition. Although many of the observed differences appear small, all differences were significant with p<0.001. We believe these differences are representative of the measurement error resulting from the poor correspondence between the CTR’s hypothetical attitudes and the TRT’s reported experience. It would also appear that, on average, the mean reactions for negative sentiments are small. For example, the mean level of annoyance, concern, and confusion reported by each group are all below 0.50 which, given the range of 0 to 3, can be loosely interpreted as the mean for each group being close to “not at all.”

Discussion
Hypothetical questions are unique in that they inherently present risk of bias by asking respondents to report how they would behave amid imagined circumstances. This bias occurs when attitudes and resulting intentions are incongruent with observable behavioral outcomes. In our study, all respondents possessed a common frame of reference, i.e., the traditional version of the survey which they answered in a prior round, and we observed the CTR consistently exhibiting less preference for the hypothetical protocol than the TRT across several dimensions. We believe this is an illustration of the incongruency between respondents’ attitudes and behaviors when conceptualizing a hypothetical survey experience.
Our data allowed us to identify and evaluate aggregate response bias, but we did not have data on respondents’ existing attitudes or their understanding of existing social conventions, such as their current attitudes toward privacy and data security. Such data could disentangle response bias stemming from the hypothetical context from other causes of measurement error. For example, if data were available on an individual’s attitude toward privacy, it could be analyzed to determine if people more sensitive to privacy issues are less likely to support the treatment before experiencing it, leading to greater bias. We believe that respondents’ prior (and ongoing) participation in longitudinal data collection is evidence that, at a minimum, they are not averse to disclosing the information requested in the SDR. This is not to say, however, that respondents’ attitudes on privacy would be accepting of any change to the survey format. Without other attitudinal data on respondents, it is impossible to rule out whether or not the TRT (dependent interviewing protocol) could raise concerns over disclosure.
Although we identified significant response bias indicating that the CTR was consistently less receptive to the hypothetical treatment, the intention of this experiment was not to identify measurement error but to make a decision about the future administration of the survey, and hopefully reduce the burden on the panelists. Even without the experiment to implement the dependent interviewing treatment, the responses to the CTR’s hypothetical questions would have supported dependent interviewing as an improvement to which respondents would be receptive. So, although we caution about the bias in hypothetical questions, in this study, the bias would not have influenced the outcome (i.e., the decision to implement or not). Perhaps the bias would have been more problematic if the data indicated respondent ambivalence about the treatment or the decision required more exacting evidence.
The field of social surveys is rapidly evolving with new technologies and sources of data offering promises of data collection efficiency and cost reductions. When testing new techniques and collecting data to understand how research participants relate to unfamiliar methods (and their likely adoption of new methods), hypothetical questions may be necessary, but researchers should be aware of the bias and risks they present. We recognize, however, that depending on the specificity of the research question, the risk may be minimal and the bias may not be problematic. We share our results to enrich our understanding of the potential for bias in measuring hypothetical intentions and encourage further work in this area.
Acknowledgements
This paper and the research were made possible by the National Center for Science and Engineering Statistics (NCSES) at the National Science Foundation and the Oak Ridge Institute for Science and Education Fellowship Program. We would also like to thank Dr. Brady West for providing valuable guidance and feedback on our work. This paper was submitted while Adam Kaderabek was a master’s student in the Program for Survey and Data Science at the University of Michigan and Jennifer Sinibaldi was the Research Director at NCSES.