INTRODUCTION
Tobacco control programs use surveys to assess changes in behaviors over time, document intervention outcomes, inform their programmatic approach, and identify disparities. Researchers must weigh aspects of survey design and methodology given the parameters of time and budget to optimize results (Biemer 2010). Survey quality is a dynamic concept that takes into account resources and stakeholders and recognizes the need to balance quality dimensions, including accuracy, timeliness, and relevance (Biemer 2010; Juran and Gryna 1988). Survey mode, sampling frame, and sample size are some of the parameters that can be modified to optimize survey quality.
Tobacco control programs have traditionally relied on phone surveys to conduct surveillance. Participation rates in epidemiologic studies have declined (Galea and Tracy 2007; Groves 2011), including among phone surveys (Hu, Pierannunzi, and Balluz 2011; Pew Research Center 2012). As households move from landline to cell phones, researchers have added cell phone frames, but response rates continue to decline (Pew Research Center 2012). Recruitment and data collection via phone are resource-intensive, requiring staffed call centers and repeated call attempts.
As technology becomes increasingly accessible in the general population (Zickuhr and Smith 2013), online surveys become more viable, offering potential advantages for improving data quality and lowering costs (Dillman, Smyth, and Christian 2014). However, many online surveys rely on existing panels that do not allow for representative estimates—a critical surveillance need.
An alternative to online panels is the use of address-based sampling (ABS) to send invitations by mail to an online survey, which has been used successfully to recruit individuals to online surveys (B. L. Messer and Dillman 2011). ABS provides an opportunity to offer a paper survey for those who cannot complete the survey online.
Mounting evidence supports mixed method designs to optimize population estimates in survey research (Dillman, Smyth, and Christian 2014; Hoebel et al. 2014; B. Messer, Edwards, and Dillman 2012). We explored whether a mixed method design is a feasible alternative to phone-only surveys for tobacco control surveillance.
The aim of this study was to compare population estimates across survey protocols in an adult tobacco survey in New York. We pilot-tested paper and online protocols for New York Adult Tobacco Survey (NY ATS) data collection with ABS. We present a comparison of response rates, respondent demographics, outcome measures, and costs from a 2015 study using phone, paper, and online survey protocols.
METHODS
Sample
The data collection we discuss involves cross-sectional surveys of adult New York State residents conducted as part of the evaluation of the NY Tobacco Control Program. We included noninstitutionalized English- and Spanish-speaking residents of New York aged 18 or older. We used landline phone, cell phone, paper, and online data collection protocols. The NY ATS-Phone survey uses a dual frame design: a random-digit-dial frame containing landline phones and a cell phone frame. We selected a simple random sample from each of the two frames. The 2015 NY ATS-Phone sample was designed to be statistically representative of New York adults aged 18 or older and included outreach to 10,770 landline numbers and 34,959 cell phone numbers. If the landline phone number yielded more than one eligible adult respondent, we randomly selected one subject by identifying the eligible individual with the next birthday; cell phones are treated as a single user device, such that the individual responding is assumed to be the only user, and no additional selection is made. Participants were provided a $20 incentive after completing the survey. We administered the NY ATS-Phone via computer-assisted telephone interviewing (CATI) and fielded quarterly data collection; for this analysis, we pooled data for all quarters of 2015.
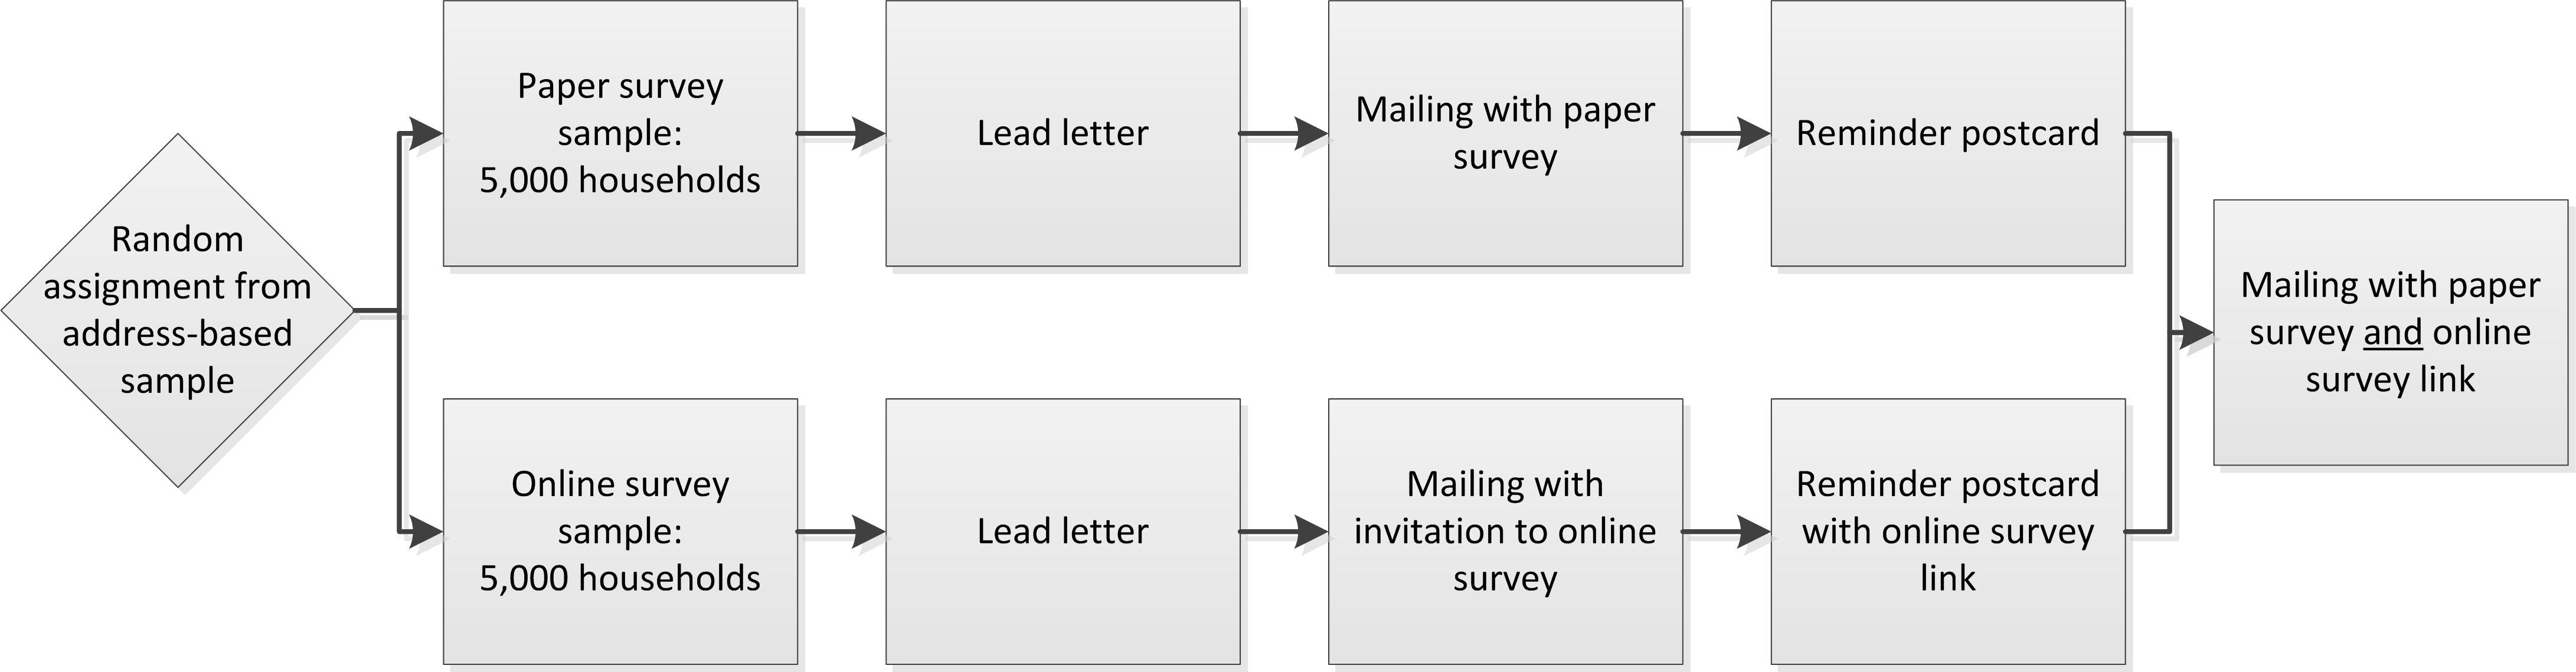
For online and mail data collection, we drew an ABS from the U.S. Postal Delivery Sequence File, a frame containing addresses maintained by the U.S. Postal Service (Link et al. 2008). We selected 10,000 New York households, stratified using Census block-groups with high- or low-predicted smoking rates. In the mailed materials, we asked that the adult with the next birthday participate if there was more than one eligible adult in the household. We randomly assigned selected households to one of two conditions: (1) 5,000 households received a paper survey in the initial survey mailing, and (2) 5,000 households received a letter inviting them to participate in the online survey (Figure 1). We sent each household in both sample groups a lead letter to let them know that they would be receiving an invitation to participate in a survey. Several days later, we sent them a $5 bill and an invitation to complete the survey, sending one group paper surveys and the other group a website and unique login code. One week later, we sent each household a reminder postcard. Four weeks after the initial mailing, we sent a final survey invitation to all households that had not yet responded, offering both sample groups the paper survey and the online survey. The data collection period was May through July 2015. The online and paper surveys included a subset of the phone survey questions. The 2015 NY ATS-Phone survey included 140 questions (counting all potential questions regardless of skip patterns), the online survey contained 49 questions, and the paper survey contained 41 questions. The wording and structure of questions regarding demographics and smoking-related outcomes addressed in this paper were consistent across instruments.

Measures
Each of the NY ATS protocols in this study collected data on tobacco use, cessation attempts, attitudes toward tobacco control policies, and participant demographics. This paper focused on comparing demographic measures, including age, gender, race/ethnicity, and education, and three key outcome measures: smoking status, past-year quit attempt, and tobacco policy support. We classified respondents as current smokers if they had smoked more than 100 cigarettes in their lifetime and answered “some days” or “every day” to the question, “Do you now smoke cigarettes every day, some days, or not at all?” We classified respondents as having made a recent quit attempt if they responded “Yes” to the question, “During the past 12 months, have you stopped smoking for 1 day or longer because you were trying to quit smoking?” We measured support for a policy banning pharmacy sales of tobacco products by aggregating responses of “strongly in favor” or “somewhat in favor” to the question, “What is your opinion about policies that ban the sale of all tobacco products in pharmacies? Are you strongly in favor, somewhat in favor, neither in favor nor against, somewhat against, or strongly against?”
Weighting
We used multiple steps to construct the weights for the ABS and phone NY ATS. For both surveys, we made a nonresponse adjustment within each stratum and weighting class. We made a household adjustment to the weights to account for the selection of one member of the household. We made adjustments for the number of phone lines to take into account that a respondent may be able to be contacted through multiple landlines or cell phones among the phone sample. We also adjusted the phone sample weights by a composite factor for those who have a landline phone and cell phone, to account for the overlap in the sampling frames. Finally, we calibrated both ABS and telephone surveys to 2013 U.S. Census estimates for New York State adults. For the ABS sample, we calibrated the weights to Census population estimates for age by gender, phone usage, race/ethnicity, and educational attainment. We used the same calibration margins for the phone survey as the ABS survey, with the addition of geographic status (New York City or the rest of New York).
Analysis
For response rate calculations, we analyzed survey data in four respondent groups: those who participated by landline phone (“landline”), those who participated by cell phone (“cell”), paper sample, and online sample. Although ABS-selected respondents could have responded by either paper or online, we calculated response rates based on the group in which they were originally randomly assigned. Forty-six households responded to both the paper and online surveys; for these cases, we kept data that corresponded to the first recruitment strategy. For analyses of demographic variables (age, gender, race/ethnicity, and education) and outcome variables (smoking status, recent quit attempt, and tobacco policy support), we analyzed survey data in four respondent groups: landline, cell, paper, online. Some respondents were offered both paper and online survey options; we report outcomes by the mode in which they completed the survey. For cost-per-complete analyses, we analyzed data in three respondent groups: phone survey sample, paper survey sample, and online survey sample.
We used guidelines for constructing response rates from the American Association for Public Opinion Research (AAPOR3) (Centers for Disease Control and Prevention 2015). We present unweighted demographic estimates alongside 2013 U.S. Census estimates for New York State adults, from the Annual County Resident Population Estimates by Age, Sex, Race and Hispanic Origin, Vintage 2013 (U.S. Census Bureau 2013). For educational attainment, we used the 2013 5-year summary American Communities Survey file. We present weighted data for tobacco outcome measures. We used t-tests for comparisons of unweighted and weighted means for the four protocols.
We estimated costs per completed survey inclusive of incentives, phone costs, printing, postage, and study management (e.g., planning, data collection, programming, and oversight); we present costs relative to the lowest-cost design, which was paper. Due to the logistics of survey administration and cost documentation, we calculated cost-per-complete estimates based on the protocol (i.e., landline and cell phone costs were combined to yield a phone cost-per-complete). We also conducted an additional cost-per-complete analysis including only incentive costs.
RESULTS
Response Rates
The cell phone response rate was the lowest (14.7%), and the paper survey response rate was the highest (38.9%) (Table 1). We gave respondents in paper and online survey sample groups the option of completing the survey either on paper or online in the last recruitment mailing; approximately half of those who were in the online survey sample responded via the paper instrument (N=567), and the overwhelming majority of those in the paper survey sample completed the paper instrument (N=1,633) (data not shown).
Demographic characteristics of participants
On most measures, the distribution of demographic characteristics differed between cell phone respondents and all other protocols, and cell phone respondents appear closest to Census estimates for the New York population (Table 2). More landline, paper, and online respondents were white, aged 65 or older, and female, compared with cell phone respondents. Paper and online protocols achieved a more even distribution across age groups than the landline protocol, and more online respondents reported higher educational attainment than other protocols. Overall estimates for the RDD phone sample and the ABS sample are included for reference.
Tobacco Outcomes
Weighted estimates of current smoking differed by survey protocol in our analyses (Table 3). The smoking prevalence estimate was lowest among online survey respondents and highest for the cell phone protocol, which was higher than estimates for landline, online, and paper estimates.
There were no statistically significant differences by survey protocol for reported quit attempts (see Table 3). The percentage of reported quit attempts ranged across survey protocols from 63.0% to 67.6%. Estimates for the RDD phone sample, ABS sample, and New York’s Behavioral Risk Factor Surveillance System are included for reference (where available) (Table 3).
More than half of New York adults supported a policy to ban the sale of tobacco products in pharmacies (see Table 3). Support was significantly higher among the paper survey respondents compared with landline and cell phone respondents (P<.01).
Costs
Using paper survey costs as the benchmark against which the other survey protocol costs were compared, the online survey was approximately 1.4 times the cost of the paper survey protocol, and the phone survey was approximately 2.8 times the cost of the paper survey (Table 4). Paper surveys with the $5 pre-incentive sent in all initial mailings was the lowest cost at approximately $15 per complete (Table 4). Online and phone surveys had similar incentive costs per completed survey. Incentive cost-per-complete varied by survey design. This calculation—used here to understand relative net costs per completed survey—does not take into consideration the design effect (and effective N) which could vary by mode and other factors related to the sample design.
CONCLUSIONS
Effective tobacco control survey efforts require quality estimates via efficient data collection protocols to document intervention effectiveness, contribute to the evidence base, and inform strategic funding decisions. Although phone surveys have been the traditional protocol, phone survey response rates have declined (Groves 2011). This exploratory study examined the use of ABS for data collection through paper and online surveys for tobacco-related surveillance.
Our comparison of survey protocols found that response rates differed across survey protocols, with paper surveys yielding a higher response rate than phone surveys. The number of questions varied by instrument, which may have contributed to the differences in response rates and costs. In the last recruitment mailing, we offered the group originally invited to complete online surveys the option to respond via online or paper surveys, and only half of those who completed the survey completed it online; the rest completed a paper survey. Cell phone respondent demographics appeared to align most closely with Census estimates, but the cell phone protocol is resource-intensive and has a lower response rate. Nearly half of landline respondents were aged 65 or older, but paper and online respondents were somewhat more evenly distributed across age groups. The proportion of online and paper survey respondents who were white was lower than among landline survey respondents, which was closer to the Census estimate and the cell phone sample.
Tobacco-related outcome measures differed across protocols, even after weighting. The cell phone sample had the highest smoking prevalence, almost 10 percentage points above that of the online sample group. We acknowledge that factors not accounted for in our weighting may have affected these estimates. A mixed-mode approach may yield a more representative prevalence estimate than a single mode.
Each survey approach has advantages and disadvantages. Paper and online surveys offer the ability to show images to respondents, which is not feasible via phone. Cell phone survey respondents appeared to be most demographically similar to Census data, but cell phone survey response rates were lowest. Online and phone surveys provide skip pattern functionality not easily incorporated into paper surveys. Online surveys conducted with ABS allow more scientifically rigorous selection of participants (enabling representative estimates) than online panels maintained by online survey vendors. In this study, paper and online surveys had lower costs-per-complete than phone surveys, although the phone survey was a longer instrument.
This study has limitations. First, we acknowledge the limitations of data obtained using different sampling frames. Dual-frame RDD phone survey methodology is standard practice for yielding probability-based samples of households using phone surveys (Fahimi 2014). The ABS frame is recognized as a reliable frame for making population estimates (Link et al. 2008) but is fundamentally different from the phone frame; both may introduce coverage error. Second, the phone survey instrument contained approximately 3 times more potential questions than the paper and online survey instruments. Third, we did not quantify the difference that survey mode may have on survey response, although it has been documented elsewhere (de Leeuw 2005; Dillman, Smyth, and Christian 2014).
This exploratory analysis examined population estimates across survey protocols for tobacco-related surveillance to inform enhancement of tobacco surveillance methodology. We found that paper and online surveys, using an ABS frame, had higher response rates and lower costs-per-complete compared with phone surveys. Paper and online ABS surveys may be viable components of a comprehensive surveillance strategy to estimate the prevalence of tobacco-related behaviors and attitudes among the adult population; the field would benefit from exploratory research into how data across frames can be combined. In a dynamic context that has seen changes in the way individuals respond to conventional survey research methods, understanding the opportunities and limitations of various survey designs helps researchers maximize data collection efficiency while continuing to calculate population estimates.
Acknowledgments: The authors thank Burton Levine at RTI International for initial conversations that laid the foundation for this analysis. This study was funded by the New York State Department of Health as part of an independent evaluation of the New York Tobacco Control Program. The conclusions in the paper are those of the authors and do not represent the views of the New York State Department of Health.