Introduction
Social media platforms such as Twitter and Facebook offer relatively inexpensive access to a large population base. Moreover, social media platforms often contain information that allows researchers to locate otherwise hard-to-reach populations. Current studies have used non-probability methods to collect data e.g., (Guillory et al. 2018; Hsieh and Murphy 2017), given the inherent coverage error of social media user base for representing general population. The non-probability design which these studies employ prevents inference to populations larger than the respondent sample. Furthermore, while research has been conducted to correct for potential non-sampling error, it is not clear if the inherent bias of a non-probability sample can be corrected (Dever, Rafferty, and Valliant 2008).
Use of random, probability-based samples in social media-based research has been more challenging due to barriers to identifying and/or developing sampling frames of social media users and recruiting social media users from a predetermined sample. Such an approach, if it could maintain the other advantages of social media-based research (such as resource efficiency and the ability to locate hard-to-reach populations), would confer several advantages. First, a random sample allows inference to all of the social media population. Second, adjustments to correct for nonresponse bias and coverage error that assume a random sample can be applied. Third, multi-frame adjustments, such as the composite method (Brick et al. 2006) or single-frame estimation (Lu, Peng, and Sahr 2013), can be used combine a social media sample with larger probability samples and still maintain inference to the desired target population.
In this paper, we will describe a methodology for randomly selecting a sample from Twitter and oversampling a hard-to-reach population. Specifically, we demonstrate our approach using a sample of youth (persons aged 14 to 21) Twitter users with the goal of oversampling sexual and gender minorities (i.e., persons who identify as lesbian, gay, bisexual, transgender, questioning or other non-heterosexual or non-cisgender persons).
Methodology
The sampling methodology consists of five steps: (1) constructing the sampling frame, (2) assigning frame members to a stratum based on their likelihood of being in the minority group of interest, (3) selecting a random sample with an oversample of the minority strata, (4) collecting data through the Twitter advertising application, and (5) post-survey weight adjustments.
Constructing the sampling frame
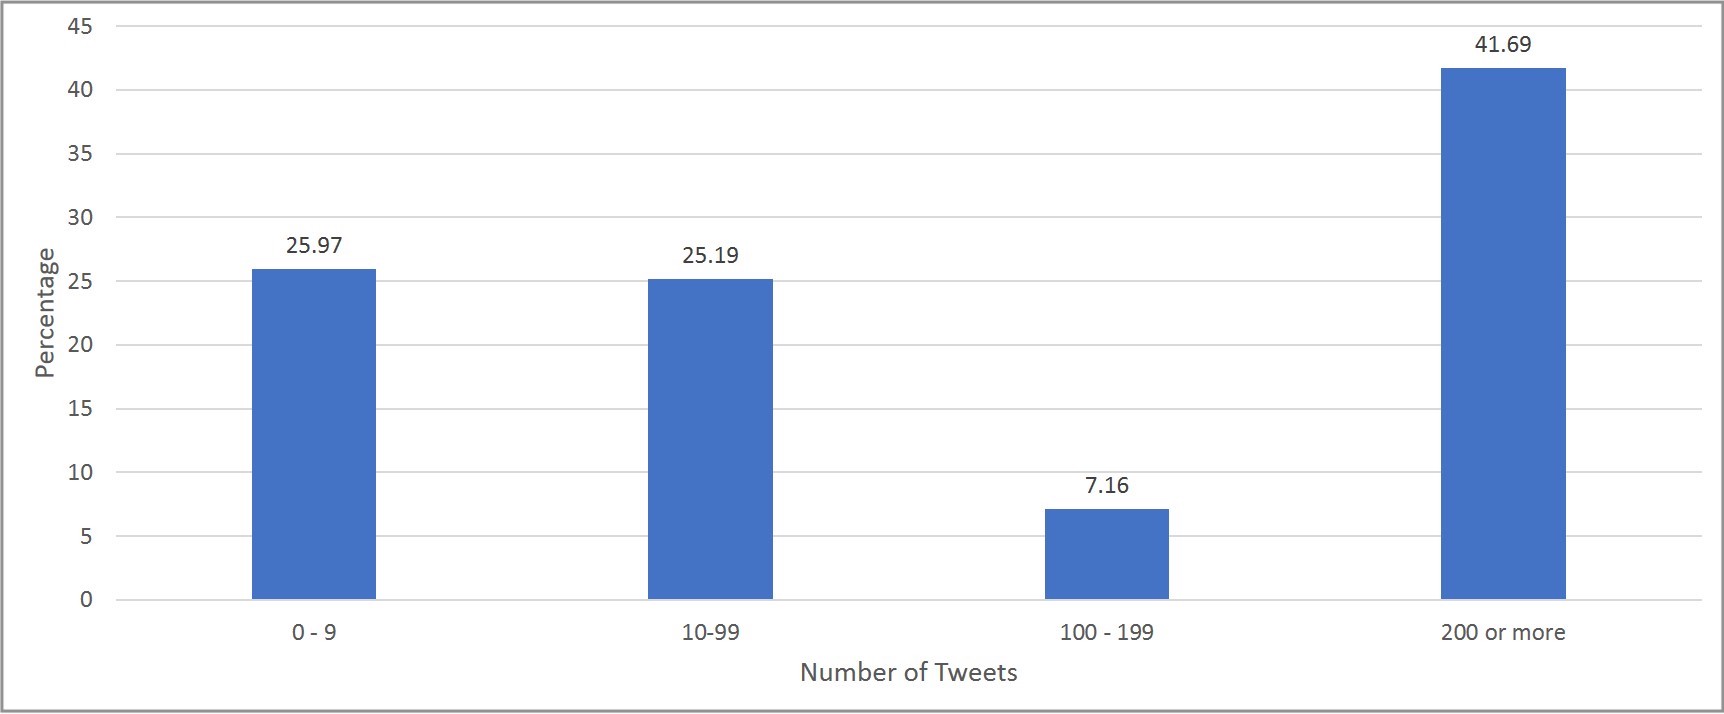
Twitter allows researchers to access information through an application programming interface (API)[1]. While the API does not provide direct access to all Twitter users, it does allow the identification of all active Twitter identification numbers[2]. Therefore, a systematic sample of IDs can be drawn from an ordered listing of ID numbers to construct a frame. In our case, we drew a systematic sample of ID numbers between 12 and 5,000,000,000[3]. Our systematic sample, which represents all U.S. active Twitter users, selected 421,000 ID numbers. We used the GET user_lookup to select users. Figure 1 presents selected frame by the number of tweets each selected ID publicly sent in the past two weeks.

The size of the frame should be based on the sample size needed (see step 3). Even though a sample is drawn to construct the frame, no weights are constructed at this step because the exact number of active Twitter users is unknown, and all frame units have an equal probability of selection. Correction for the universe size can be applied through a coverage error adjustment.
Assigning frame members to strata
To assign a frame member to a stratum, for each frame member, based on members’ characteristics of research interest, we have to rely on additional big-data analysis on members’ social media data. In the case of our current study, we further extracted and analyzed the members’ publicly available tweets to discern their characteristics. Public tweets can be pulled from the API and scanned for keywords related to the minority population of interest.[4] For a very rare population, it may be necessary to pull tweets from a wide time window.[5] As seen in Figure 1, the frame will likely contain many users who send few tweets (26% of our frame sent fewer than 10 tweets) and will require a larger time window to minimize specification error.
An algorithm can be developed to determine the likelihood of a person’s inclusion in the minority population of interest. Our approach has three steps. First, focus groups with persons in the minority population of interest can be used to identify keywords most likely to be used by persons in the population[6]. Second, based on the number of keywords used by each frame member, IDs can be assigned to an appropriate number of strata. The number of strata will depend on the anticipated accuracy of the algorithm; if accuracy is expected to be low, one may want more stratum levels to vary the oversampling rates and minimize the potential specification error in the algorithm. Third, after the initial data collection, the algorithm can be revised by comparing persons who self-identify as being in the minority population with the initial set of keywords identified through focus groups. For example, tweets of the self-identified minority persons can be reviewed to identify which keywords are highly correlated with a person’s minority status and whether additional keywords should be added to the algorithm.
Selecting a random sample
Once frame cases are assigned to a stratum, a simple random sample can be drawn within each stratum. Several factors should be considered when determining the number of IDs to sample within each stratum. First, consider the final desired respondent distribution, accounting for the unequal weighting effect caused by oversampling in the strata with a high likelihood of containing the minority population of interest. As with a sample from a list frame, the unequal weighting effect should be minimized while ensuring the increased number of respondents in the minority population. Second, the anticipated click and survey completion rate should be considered. This is analogous to a response rate. This rate should be assumed to be small because even those who click on the survey link may not take the survey. Third, account for any additional population restriction rates. For example, if the target population consists of youth ages 13–21, then the frame should be enlarged to account for some being outside the desired age range. Fourth, consider the Twitter eligibility rate. Twitter will review all uploaded ID numbers to determine if they are truly active and legitimate (i.e., not bots), which tends to reduce the list significantly (in our experience, by 70%–90%). Twitter indicates only “existing, active” members are retained in the tailored audience list[7]. Since our list from the application programming interface (API) include a large portion of users with few tweets, our high rate of exclusion is potentially plausible, but needs to be taken into account for future samples; however, Twitter does not allow one to see the final tailored list after the verification process is complete. Therefore, it is important to consider how the exclusion of these cases may impact coverage error. By restricting the tailored list to only “existing and active” accounts, the inferential population is limited accordingly. Furthermore, if the verification process excludes borderline active cases then the resulting list may result in undercoverage.
Once sample size adjustments for each of these factors are developed, the starting sample size for each stratum can be calculated. If the resulting sample size is larger than the number of cases available in the stratum, then a census of cases within the stratum should be taken. Design-based weights can be constructed based on the inverse probability of selection within each stratum.
Collect data through Twitter advertising application
Once a sample is drawn, the list of Twitter IDs can be uploaded to the Twitter advertising application. The Twitter advertising application must be used because, although the Twitter handle for each ID can be known through the API, neither direct messaging persons who do not already follow you, nor sending the invitation through a public tweet to the sample members, is allowed under the Twitter user agreement. Any additional population restrictions (e.g., age range or country restrictions) can then be applied to the Twitter-scrubbed ID list. A “creative” (a tweet inviting persons in the list to click on the survey link) can then be sent out to sample members and is embedded in the members’ “Twitter feed” along with the tweets from the users they already follow.
Once a sampled person clicks on the link in the creative, the person can be taken to a survey landing page to complete the electronic consent and survey. Because this is a random sample, the data collection period should be based on a fixed period of time (e.g., two weeks) rather than a number of completed interviews. Furthermore, we recommend providing an incentive in order to increase the completion rate and to make direct contact with the respondent, who can be asked to follow the survey Twitter handle to receive the incentive (and can then be followed up with through direct message rather than another ad campaign).
Post-survey weight adjustments
Because limited information about nonrespondents is known, for practical purposes, only a coverage adjustment is feasible to construct analysis weights. Therefore, to minimize potential bias, we recommend embedding survey items that are not of analytic interest but are highly correlated with the outcome of interest, in addition to demographics. Candidate items should be found in a probability survey covering the target population of interest. Finally, an estimate of the proportion of the minority population of interest is needed to ensure estimating the combined minority and non-minority populations accurately reflect the total population. Adjustments can be applied to the design-based weights as described in (Valliant, Dever, and Kreuter 2013).
Application to Youth Population Survey
We applied our methodology to a survey of youth where we wanted to oversample sexual and gender minorities (SGM) persons to better understand differences in risk factors for suicide ideation and attempt between SGM and non-SGM youth. National probability samples of youth that measure suicidality, such as the Youth Risk Behavioral Surveillance System (YRBSS), do not get enough self-identified SGM persons to do within-SGM and between SGM and non-SGM comparisons without pooling multiple years of data. For example, the 2017 YRBS identified 14% of the unweighted population as a sexual minority[8] (Centers for Disease Control (CDC) 2018).
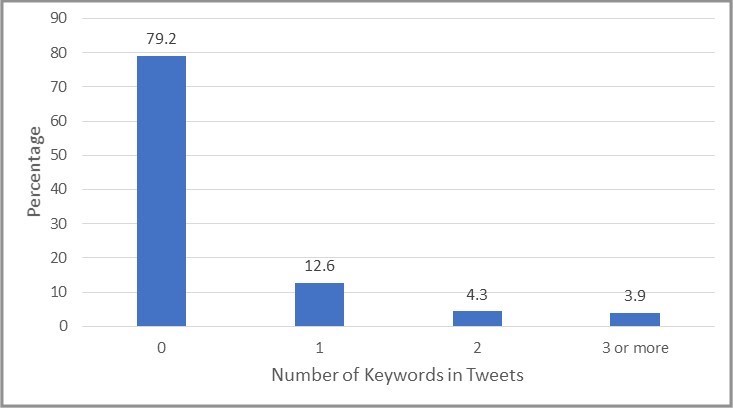
We constructed a frame of 421,000 Twitter IDs (Figure 1). We held a focus group with SGM persons from a local high school, who identified over 100 terms to be used in the algorithm.[9] Figure 2 presents the distribution of our frame based on the number of keywords used. The number of persons who used at least two key words (8.2%) was small relative to the YRBS population which provided validity that our algorithm was not overly inclusive.

Based on this distribution, we created three strata: (1) 0 or 1 keywords tweeted, (2) two keywords tweeted, and (3) 3 or more keywords tweeted. Because this was a pilot study and we limited the size of our frame, we took a census from all strata to assess the accuracy of the algorithm.
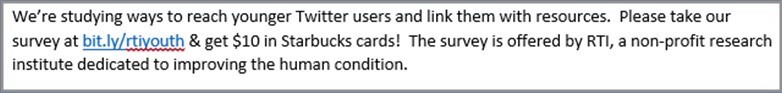
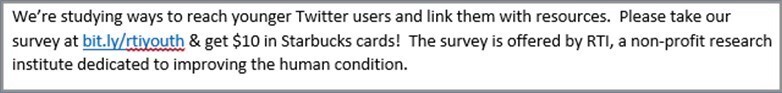
Figure 3 presents the creative tweet we used to invite sampled IDs to our survey. Because we wanted a general youth population for analysis, our tweet did not mention anything about wanting to increase the proportion of SGM persons. Therefore, any enhanced representation of SGM persons in the second and third strata are likely due to the accuracy of the algorithm developed.
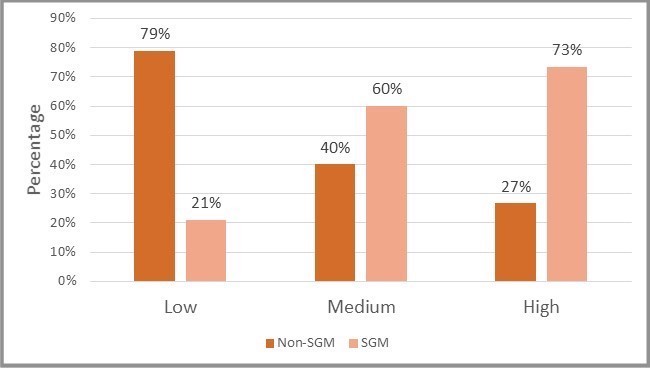
Based on our sample, we obtained 72 completed surveys—52 in low-likelihood SGM stratum, 5 in the medium-likelihood SGM stratum, and 15 in the high-likelihood SGM stratum. The low number of surveys collected was largely due to the high number of frame cases removed during the Twitter verification process and the low (but typical) click rate. Figure 4 presents the distribution of respondents by stratum and self-identified SGM status. The figure shows our algorithm was successful in predicting the SGM status of frame members based on their prior tweets. Overall, 36% of our respondents self-identified as SGM—a full threefold increase over the YRBS estimate. Furthermore, our algorithm effectively classified frame members, such that an estimated 73% of respondents in the high stratum self-identified as SGM, 60% of medium stratum respondents self-identified as SGM, and 21% of low stratum respondents self-identified as SGM.

For post-survey adjustments, we used data from the Pew Research Center to benchmark to one-third of the teenagers[10] and 45% of young adults.[11] For coverage adjustments, we incorporated six potential items. First, two demographic items were included—age/year of school and race/ethnicity.[12] Second, we included four potentially correlated items from the YRBSS. Two items covered bullying —physical (Q23) and electronic (Q24)—and two items covered social connectedness to family and school.[13] The estimate for SGM can also be obtained from the YRBS using the sexual behavior (Q66) and sexual identity (Q67) items.[14] Using weighted proportions from control total sources, the proportion of youth for each characteristic can be applied to the benchmark population and incorporated into a coverage adjustment model. This approach can allow for inference to the Twitter population or the broader national youth population.
Discussion and Limitations
Our methodology selects a random sample from Twitter and, through an algorithm using publicly available tweets, stratifies and oversamples a minority population. While our pilot study was successful, we identified several areas for improvement in future applications.
The biggest area to consider is the size of the frame. First, because the frame is a random subset of all Twitter users, the frequency with which Twitter members use Twitter varies. With 26% of users sending less than 10 tweets in two weeks, a large portion of the sampled population may infrequently check their Twitter accounts. Second, while Twitter’s scrubbing of sampled IDs is likely beneficial in removing bots and ineligible cases, it does require one to select a much larger sample from the API to account for the reduction in frame cases.
Another area for consideration is the inability to indicate how many times and how often each person sees the advertisement in the Twitter ad system. Twitter indicated that a person will see the ad three times, on average, during a short data collection period. However, this number is not fixed for all sampled persons, with some seeing the ad fewer times and others seeing it more frequently.
A third area for consideration is coverage of the Twitter population. From an inferential perspective, a random sample is better than a non-probability sample; however, a random sample of active Twitter users can only make inference to all active Twitter users. If there is large coverage error, then even a random sample may be biased to the larger population of interest. For example, Twitter only covers one-third of all youth as of a 2015 Pew study. Therefore, an ideal study using this methodology would use multiple social media platforms and then combine them using dual-frame adjustments similar to multi-frame telephone surveys. Unfortunately, at present, only Twitter allows the construction of a frame of platform users; other platforms, such as Facebook and Instagram, are limited to non-probability samples. However, if it can be shown that the Twitter population does mirror the larger population of interest, then our approach has all the statistical benefits of a random sample that a non-probability sample does not have.
We used REST API Version 1.1.
An active Twitter user is defined as someone who as tweeted at least once in the past six months.
We verified that no active ID numbers smaller than 12 exist, but we did not verify there are not active ID numbers. greater than 5,000,000,000; however, we chose this upper bound because we could not identify any ID numbers this large.
We used the GET statuses_lookup function to pull tweets.
To increase the likelihood of identifying keywords, the tweets can be pulled from around a specific time period in which the population of interest may be active. For example, around Pride month for sexual and gender minorities or 4/11 if interested in marijuana users).
Focus group participants in our study came from a local high school and self-identified as an (or were an) advocate of sexual and gender minority persons. Focus group participants all used social media, but we did not obtain usage on Twitter specifically.
Twitter indicates only “existing, active accounts” are retained after the verification process. Twitter defines their exclusion process as “Users accessing Twitter via a third party such as HootSuite are not included in the matched audience. This makes up on average around 11% of our current user base. Additionally, users who have not logged onto the platform in the last 30 days are also not included.”
The YRBS does not ask about gender identity. It does capture two of the three recognized dimensions of sexual orientation: sexual behavior (Q66) and sexual identity (Q67).
Example terms included in the algorithm included terms such as #NYPride and #queeryouth.
(Lenhart 2015) estimated the Twitter use among 13–17 year olds through a probability based Internet panel survey.
(Smith and Anderson 2018) estimated the Twitter use among 18–24 year olds through dual-frame telephone survey.
For demographic items, Twitter specific distributions can be obtained from (Lenhart 2015) or full youth population estimates can be obtained from the YRBS.
The items on social connectedness are only asked as supplemental items when included by a state or district. Therefore, their items are not included in the national YRBS data set.
The YRBS does not measure gender identity. Therefore, the estimate of SGM will be an understatement of the true proportion.