INTRODUCTION
The use of random digit dialing, while long a primary method for conducting population surveys, may need to be supplemented with alternative methods, because the risk of bias has increased due to climbing nonresponse rates and potential differences between the population of responders and nonresponders (Centers for Disease Control and Prevention 2015; Kempf and Remington 2007). Work using alternative modes such as online surveys using push to web designs (Dillman, Smyth, and Christian 2014) try to balance survey costs and timeliness of response. With smartphone ownership rates rising over 75% in the United States (Smith 2017), nearly four in ten online surveys are now completed using smartphones (Saunders 2015).
While many advances in mobile web survey design have been made within the past decade, (Buskirk and Andrus 2012) note that surveys via smartphones can take many forms including app-based survey administration. (McGeeney et al. 2015), (McGeeney and Weisel 2015), and (Jäckle et al. 2017) report the use of apps with online panels but note the limitations of using apps such as cost, lower response rates, and design limitations.
The use of apps for surveys that are offered directly to participants in rapid series without involving the web or requiring panel membership is new. Downloading an app might be seen as a barrier. Burden may actually be reduced given passive data collection through global positioning system picture, voice, video input; notification-alert system; and independence from the tether of an internet connection.
We studied the response to a mobile app survey by deploying it in a college student population who were expected to be early adopters of new technologies (Lee 2014). While the use of mobile apps for surveys is a growing field with numerous methodologic questions, in this limited scope pilot project, we sought to (1) determine if students would download the survey app, (2) assess the representativeness of the app participants; (3) determine how well the app can retain individuals across survey waves, (4) explore whether gamification within the app would improve response rates, (5) assess the rapidity of survey completion, and (6) understand the overall app user experience.
METHODS
We recruited students enrolled in one of three Vermont State Colleges (Castleton University [CU], Lyndon State College [LSC], and Johnson State College [JSC]). The advantage was access to a known population with a well-defined sampling frame, and benchmark data about health behaviors for the Castleton student population from the annual Vermont College Health Survey (VCHS).
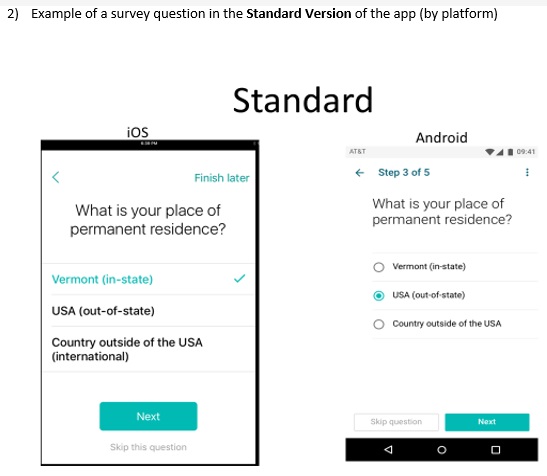
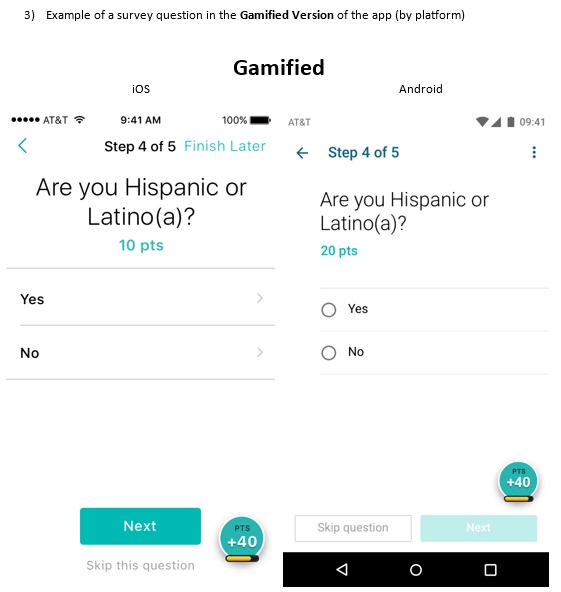
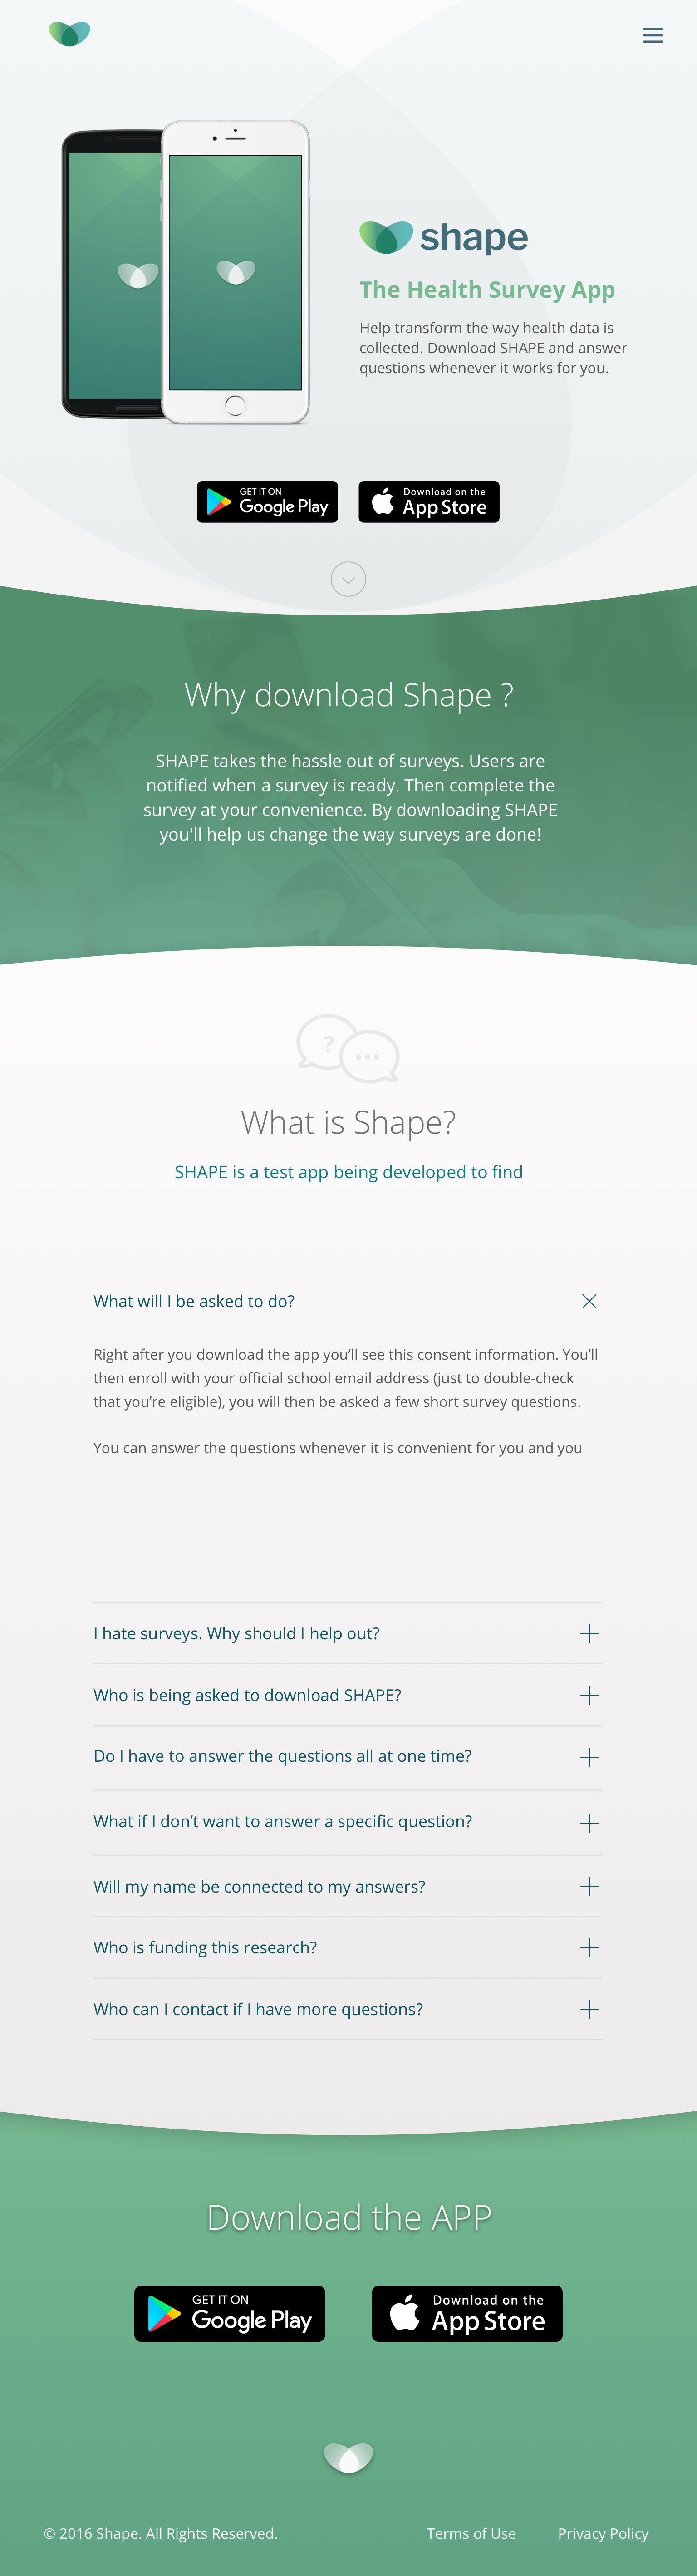
The development of standard and gamified versions of the app involved a multidisciplinary team of user interface and user experience designers, mobile app developers, communications experts, and survey researchers. This resulted in the development of a logo named “SHAPE”, a strategy for the gamified version (using points and “badges” as gamification has been suggested as one way to encourage user engagement (Lai, Link, and Vanno 2012)), and marketing materials, including a web landing page that provided information about the study and a portal to download the app. The standard and gamified app versions were developed using native technology and Medable’s Axon product for iOS and Android (Medable Inc., Palo Alto, CA, USA). Randomizing participants allowed for an evaluation of the effectiveness of a gamification approach. See Appendix A for additional details on the SHAPE brand and gamification.
Recruitment strategies directed students to a website to download the app. A multipronged approach to recruit students was employed that included face-to-face interaction, distribution of flyers, announcements via email, the student newspaper, listservs, etc. Our goal was to reach the entire student body.
After downloading the app, the informed consent was app administered, and eligible participants (age 18 or older with a participating institution email) were provided with the first survey. A total of three surveys were delivered through the app. Particpants were notified via push notifications about Surveys 2 and 3, regardless of completion of Survey 1. As with other mobile apps, participants were able to disable the notifications without alerting the research team. Survey 2 had a low initial response possibly due to the disabling of push notifications, which prompted us to also implement email notifications for Surveys 2 and 3.
Survey questions included items to allow the calculation of the net promoter score (NPS) (Reichheld and Markey 2011). The NPS is a measure of the likelihood of using a product (in this case the mobile app) and of recommending it to others. The importance of this measure is to understand the user experience. The final survey instruments can be found in Appendix B. Focus groups were also conducted after the data collection period ended to understand more about students’ perspectives on the app and why they did or did not respond to the surveys.
Participant characteristics were compared with the total student population for CU, as student population data was not available for the other schools. The raw data for the CU student population was not available, making comparison possible only at the summary level. Thus, the data are presented as frequencies and percentages. Chi-squares were utilized when appropriate to evaluate the statistical differences between groups and categories among app respondents. Means and standard deviations were used to present the distribution of some data.
RESULTS
Recruitment Effort
To direct students to the study website to download the survey app, we employed a number of recruitment strategies, including in-person recruiters, emails, posting flyers around the campuses, and pizza. School specific unique links were created for each recruitment strategy that directed students to the landing page. Google Analytics was used to summarize the traffic generated to the website by each link (see Appendix C for additional details). The most frequent traffic-driver to the website was in-person recruiting. Social media recruitment for surveys administered via mobile applications was not utilized in this study. We examined CU recruiting outcomes because enrollment data for the other two schools were not available. A total of 2,342 CU students were enrolled in 2016; the overall recruitment effort resulted in 49.5% (or 1,160 CU students) visiting the study website page.
Objective 1: Determine if students would download the survey app.
Of the 1,317 total visitors to the app download webpage, 670 downloaded the app (51%), and of these, 536 (80%) consented and were deemed eligible. The majority of participants were from the primary location (CU; N=472). The majority of app users, 82%, downloaded the app on an iOS operating system device (see Table 1). At CU, approximately 20.2% of the entire student body downloaded the app and consented to participate in the study. (Enrollment data was not available for the other two schools.)
Objective 2: Assess the representativeness of the study participants.
Table 2 shows the distribution of the demographic characteristics of the SHAPE app particpants compared to the overall 2016 CU enrollment. Individual level data were not available for CU, only enrollment percentages; therefore, statistical analyses were limited to comparisons of the distributions of demographic characteristics between mobile app respondents and the CU student population. SHAPE participants were comparable by sex and race/ethnicity. The age distribution of app respondents was younger than that of the overall CU student population, possibly due to the fact that CU has a high proportion of students in nontraditional programs (e.g., remote continuing education, professional educators). The students are typically older and are less likely to be on campus during the recruitment period.
Objective 3: Determine how well an app can retain individuals across three survey waves.
A total of 536 individuals downloaded the app (across all three schools), consented, and were eligible for the study. The majority of eligible respondents completed survey 1 (n=459; 86%). Smaller percentages of initial survey respondents completed the second and third surveys (n=160; 30% and n=153; 29%, respectively).
Cross-tabulations with chi-squared statistical tests were carried out to compare respondents who completed all three surveys (“completers”) with non-completers (Table 3). The only significant difference between the two groups was found in year in school (chi-square=9.28, p=.026).
Objective 4: Explore whether simple gamification within the app improves response rate
The gamified app performed similarly to the standard app. There were no statistically significant differences in response rates (Table 4) over the course of the three surveys by gamification status. This indicates that this particular gamified design did not improve response rates in this pilot study.
Objective 5: How rapidly did participants complete a survey after notification?
To answer this question, we broke down the time to completion into two parts: (1) how long people would wait to participate in a survey once notified and (2) once engaged, how long did it take them to complete a survey.
To answer the first question, we used paradata on percent completions by notification (from “push” to survey submission by participant) and the number of push notifications prior to completion. For Survey 1, this is the time from app download to survey completion. For Surveys 2 and 3, this is the time from first notification by email or within the app to completion. For Survey 1, 38% of respondents completed the survey when the app was launched, followed by almost 20% at push 1, over 11% at push 2, and 30% after the push 3 notification. For the Surveys 2 and 3, the highest completion rates came after the first email reminder, with dwindling returns thereafter (see Table 5).
While it could take participants several hours or days to initially engage with the survey, once engaged, participants completed the surveys quickly—for example, nearly 90% of users completed Survey 1 on average in less than five minutes. Survey 1 has a total of 17 questions, taking on average 17.6 seconds to read and respond to each questions. Similarly, Surveys 2 (7 questions) and 3 (5 questions) were completed on average in under a minute that translates to 8.6 and 12.4 seconds on average to read and respond to each question.
Objective 6: How did users rate the experience?
We included questions in the surveys and conducted focus groups to assess user experience. When asked in Survey 3 “How easy or difficult was it to use this app?,” the majority (79%) indicated “very easy” and no respondents indicated “difficult” or “very difficult.” However, this information was provided by the completers and those who found it difficult may have dropped out prior to Survey 3. The majority of completers (80%) indicated that they prefer to participate in surveys via an app. When asked about the likelihood of downloading an app like this in the future on a 0 to 10 scale with 10 representing “very likely” and 0 representing “not at all likely,” 27% indicated a 10 with a mean of 6.8 (s.d.=2.8).
A NPS question was asked on the final survey ("How likely would you be to recommend this app to a friend? Scale 0 equals “Not at all likely” to 10 “Very likely”). In the NPS, promoters (responding 9 or 10 on the scale) are defined as those who would recommend the app to friends and passive respondents (responding 7 or 8 on the scale) are defined as those would not necessarily recommend the app, but would also not say anything against it to their friends. Detractors (responding 0 through 6 on the scale) are defined as those who would actually not recommend the app to their friends. Respondents (28%) were categorized as “promoters,” 24% were considered “passive,” and the remaining 49% were considered “detractors.” This result may underreport promoters since the scale was displayed vertically (starting with the negative response of “0”) due to programming constraints. Ideally, the response options should be displayed horizontally to minimize response option bias.
Focus group respondents were drawn from completers and indicated that they liked the app and would be willing to complete more surveys and longer surveys using this methodology. The only negative comments were related to the gamified version, with focus group participants indicating a lack of understanding of what they were to do with the points they earned during the game. We did not have an opportunity to query non-completers in this pilot project.
CONCLUSIONS
The results from this pilot work show promise for use of smartphone apps in survey research. Our first and second objectives were met with 1 out of 5 CU students downloading the SHAPE app over a short time period, and participants were demographically similar to the overall CU population. Our results for objective 3 indicate that, while retention was reasonable, this is an area for future studies to investigate. We did not find in objective 4 that the gamification method we employed was successful, and this remains a task for future work. The app was reported as low burden, and a majority of the participants in Survey 3 found the app easy to use and quick to complete. In fact, as part of objective 5, the feedback suggested that future efforts could include more survey items.
At the time of our project, neither Apple nor Google provided an out-of-the-box method to report how many users deleted the app from their device. The brief development period for this pilot project did not allow time for an app embedded solution, but we anticipate inclusion of such a mechanism in future work to better differentiate reasons for attrition versus nonresponse. Based on the literature and our objectives, we encourage readers to consider: (1) exploring recruitment through social media campaigns; (2) designing a system in which users are rewarded for leaving notifications enabled, and researchers are alerted if notifications are disabled; (3) evaluating engagement methods across survey waves and potential barriers in broad population groups, particularly those who may be difficult to reach through current methodologies; and (4) testing gamification methods for diverse populations. Given the challenges of survey research today, we should pursue improved methods for recruiting subjects to collect valid and reliable survey data via smartphones.
Acknowledgment: The authors would like to thank Dr. Trent Buskirk for his expert review and input on the manuscript and Castleton University, Lyndon State College and Johnson State College for their assistance with recruitment to the study and input into the mobile application design.
APPENDIX A:
.jpg)
.jpg)

APPENDIX B:
Survey 1: Demographics and Para data, mental health questions
1. What is your assigned [insert school name] email address?
[If enters an email not one of the universits .edu addresses – end survey, not eligible]
2. What is your current age?
Under 18 - end survey (not eligible since under age)
18
19
20
21
22
23
24
25
26-29
30-39
40 +
Q1. What year are you in school?
1=1st year undergraduate
2=2nd year undergraduate
3=3rd year undergraduate
4=4th year undergraduate
5=5th year undergraduate or more
6=Graduate or professional program
7=Not seeking degree
8=Other
Q2. Which term do you use to describe your gender identity?
1=Woman
2=Man
3=Trans woman
4=Trans man
5=Gender queer or gender nonconforming
6=another identity
Q3. What is your place of permanent residence?
1=Vermont (in-state)
2=USA (out-of- state)
3= Country outside of the USA (International)
Q4. Are you Hispanic or Latino(a)?
1=Yes
0=No
Q5 Select one or more to describe your racial background. (Select ALL that apply)
(These will be coded as 1-checked, 0=not checked)
American Indian or Alaskan Native
Asian
Black or African American
White
Native Hawaiian or Other Pacific Islander
Other
Q6. How did you hear about this project? (Select ALL that apply)
(These will be coded as 1=checked 0=not checked)
From someone else
A flyer in the bathroom
A flyer on campus
Through email
Somewhere else (please specify):
Q6oth.What is the primary reason you downloaded the app? [OPEN ENDED]
Q7. Over the last two weeks, how often have you been bothered by feeling down, depressed, or hopeless?
1=Not at all
2=Several days
3=More than half the days
4=Nearly everyday
Q8. Over the last two weeks, how often have you been bothered by little interest or pleasure in doing things?
1=Not at all
2=Several days
3=More than half the days
4=Nearly everyday
Q9. Over the last two weeks, how often have you been bothered by trouble falling or staying asleep, or sleeping too much?
1=Not at all
2=Several days
3=More than half the days
4=Nearly everyday
Q10. Over the last two weeks, how often have you been bothered by overwhelming amounts of stress?
1=Not at all
2=Several days
3=More than half the days
4=Nearly everyday
Q11. On how many of the past 7 days did you perform moderate intensity exercise for at least 30 minutes?
0=0 days
1=1 days
2=2 days
3=3 days
4=4 days
5=5 days
6=6 days
7=7 days
Q12. On how many of the past 7 days did you perform vigorous intensity exercise for at least 20 minutes?
0 days
1 days
2 days
3 days
4 days
5 days
6 days
7 days
Q13. On how many of the past 7 days did you perform exercises to strengthen your muscles (8-10 exercises each for 8-12 repetitions)?
0 days
1 days
2 days
3 days
4 days
5 days
6 days
7 days
Q14. On how many of the past 7 days did you perform activities to increase your flexibility or range of motion?
0 days
1 days
2 days
3 days
4 days
5 days
6 days
7 days
Survey 2: Substance abuse questions
Q15.How often have you used cigarettes?
1=Never used
2=I have used but not within the last 12 months
3=I have used it in the past 12 months
4=I have used in the last 30 days
Q16. How often have you used Electronic vapor products (e-cigarettes, e-pipes, vaping pens, vape pens, e-hookahs or hookah pens such as blu, NJOY, or Starbuzz)
1=Never used
2=I have used but not within the last 12 months
3=I have used it in the past 12 months
4=I have used in the last 30 days
Q17. How often have you used marijuana?
1=Never used
2=I have used but not within the last 12 months
3=I have used it in the past 12 months
4=I have used in the last 30 days
Q18. How often have you used cocaine (e.g., crack, rock, blow, freebase)?
1=Never used
2=I have used but not within the last 12 months
3=I have used it in the past 12 months
4=I have used in the last 30 days
Q19. How often have you used methamphetamine (e.g., meth, crystal, ice, crank)?
1=Never used
2=I have used but not within the last 12 months
3=I have used it in the past 12 months
4=I have used in the last 30 days
Q20.How often have you used alcohol?
1=Never used
2=I have used but not within the last 12 months
3=I have used it in the past 12 months
4=I have used in the last 30 days
Q21. During the last 30 days, how many times have you had five or more drinks of alcohol at a sitting?
0=None
1=1 time
2=2 times
3=3 times
4= times
5=5 times
6=6 times
7=7 times
8=8 times
9=9 times
10=10 or more times
Survey 3: Feedback/Burden/Incentive
Q22.How easy or difficult was using this app?
5=Very easy
4=Easy
3=Neither easy nor difficult
2=Difficult
1=Very difficult
Q23.How likely would you be to recommend this app to a friend?
Not at all likely 0 1 2 3 4 5 6 7 8 9 Very likely 10
Q24.Knowing what you know now, how likely would you be to download an app like this in the future?
Not at all likely 0 1 2 3 4 5 6 7 8 9 Very likely 10
Q25.All things considered, how do you prefer to participate in surveys?
1=In person with an interviewer
2=Via telephone with an interviewer
3=Via mail with a paper survey
4=Over the web with emailed invitations
5=With an app on your phone
6=Some other way
7=I don’t participate in surveys
Q26.How much do you think you should be paid for downloading the app and answering the survey?
1=Nothing
2=Less than $1 to under $3
3=$3 to under $5
4=$5 to under $7
5=$7 to under $10
6= $10 or more