
Background
As more people use the Internet and smartphones to take surveys, understanding these users’ experiences becomes increasingly important (Couper and Peterson 2016). One recent development in mobile and web survey design includes ways of helping the respondent automatically move through a survey. These types of measures are referred to as automatic advancement, auto-advance, or auto-forwarding features. Automatic advancement techniques vary in their application, with some presenting a single question on a page and automatically pushing users to the next page of the survey upon selecting an answer, without having to click a ‘Next’ button (Hays et al. 2010). Other forms of automatic advancement, such as the one that we apply here, automatically move users through questions on a page as each question is answered (Norman and Pleskac 2002). Such designs are intended to help reduce respondent burden and ensure that respondents answer each question presented to them, since the advancing function relies upon, though is not strictly dependent upon, questions being answered. A related feature is the horizontal scrolling matrix (HSM), which combines features of a matrix or grid of questions with a single-question format. It keeps a common set of response options fixed on the page while automatically cycling respondents through a series of questions, one at a time, as they answer each (de Leeuw, E.D. et al. 2012).
Antoun and colleagues’ (2017) work toward design heuristics for surveys on smartphones provides a review of efforts to optimize surveys for smartphones, including use of the HSM and automatic advancement features (Antoun et al. 2017). Antoun et al. (2017) did not recommend use of an automatic advancement feature for a one-time survey on a smartphone, because automatic advancement seems to require learning on the part of the respondent to use it properly. Selkälä and Couper’s (2017) work on the use of auto-forwarding compared to manual forwarding focused on the cognitive response processes underlying respondents’ experiences and how these interact with the design feature. Their literature review covers much of the limited work in the area of automatic advancement designs. In Table 1, we summarize findings for both HSM and automatic advancement features, illustrating not only the dearth of published work on this topic but also the lack of clarity as to effects that such designs have produced.
In this paper, we focus on the design aspects of an automatic advancement feature used in a survey of law school students in the United States and Canada. Our research extends the limited work in the area of automatic advancement for surveys. By exploiting a randomized assignment of automatic advancement to half of our respondents and administering traditional manual forwarding to the other respondents, we test for differences in survey duration, straightlining behavior, item nonresponse, breakoff rate, counts of changed answers, and user satisfaction between the two groups.[1]
Methods
We implemented our experiment in the 2017 administration of the annual Law School Survey of Student Engagement (LSSSE). The LSSSE is designed to measure the effects of legal education on law students.[2] The first six pages of the survey are the same for all students with the exception of a few small variations in questions appropriate to the Canadian students. Each page asked 15 questions on average, with a minimum of nine questions and a maximum of 20 appearing on a single page. We will refer to these first six pages as the core of the survey in the analysis that follows.[3]
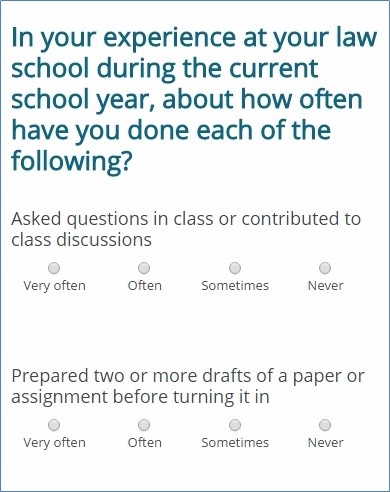
The majority of questions in the LSSSE take the form of a stem, a set of items, and the same set of response options. We broke out the stem and items with what we call a “sticky stem” for each set of questions, so that the respondent always sees the question stem as the items change with the automatic advancement feature (Figure 1). In Figure 1, as the respondent answers the item “Asked questions in class or contributed to class discussions,” the item advances upward, out of sight, while the next item, “Prepared two or more drafts of a paper or assignment before turning it in,” advances to beneath the question stem, taking the place of the item just answered.[4]

The LSSSE was in the field from February 21, 2017, to April 23, 2017, with a sample size of 39,350 students across 77 law schools in the United States and Canada. All law students at institutions that choose to participate in the study are invited to take the survey. Up to five electronic contacts are made in an attempt to gain cooperation from sampled students. The response rate for 2017 was 52.28%, or 20,574 students (AAPOR RR2). A post-survey evaluation to understand aspects of respondents’ satisfaction or dissatisfaction with the experimental design included seven questions and was conducted with students at 44 of the participating schools. The post-survey evaluation was programmed in Qualtrics (Provo, UT) and linked at the end of the LSSSE so that it would not appear to be part of the law school survey itself. When reviewing the characteristics of the schools that were selected for the post-survey evaluation, we ended up with slightly higher percentages of students attending private schools, schools in the United States, schools with smaller enrollments, and religiously affiliated schools than the sample as a whole. The 44 selected schools yielded 11,759 students eligible for this post-survey evaluation, of which 11.06%, or 1,300 students, responded. Of those 1,300 students, 642 received the automatic advancement design.
Results
Survey duration, straightlining, item nonresponse, and breakoffs
To test whether there were differences in duration, that is, whether auto-advance encouraged speeding, we could not simply compare the total time to survey completion because, as described previously, schools elect different topical modules to add to the core survey. Therefore, we examined duration on a per-page basis for respondents completing each of the survey’s core pages. We first removed page duration outliers (> 1.5 x interquartile range). Table 2 provides the upper limit in seconds for each page, along with the number of cases exceeding that limit and the resulting N for analysis for each page. Table 3 presents results of significance tests for differences in survey duration by time by page.[5]
Results for the six page were mixed. For pages 1, 3, and 5, there were no significant differences in duration (at α = .01, for this and for all tests in this “Results” section) between those with auto-advance and those with manual advance. However, for pages 2 and 4, those with auto-advance spent about 1.7–1.8 seconds longer on average on the page, and for page 6, those with manual advance spent 1.7 seconds longer. Taken together, we judge these results as being evidence of no consistent, practically meaningful difference in duration between those with auto-advance and those with manual advance.
We considered straightlining to mean that respondents chose the same response for all questions in a group that shared the same stem and response set (eight groups total). We included all respondents who completed the core of the survey (N=18,532). There was no significant difference in the average number of question sets straightlined between those with automatic advancement (.57 sets) and those with manual advancement (.55 sets).
For those respondents who completed the core of the survey, we tested for differences between the experimental and control groups in the number of items not answered, separating those using a mobile device from those using a desktop or tablet. We measured device use as the last one recorded for taking the survey, with 18.1% of respondents using a mobile device. The difference in the number of questions unanswered for those using a mobile device was not significant (.75 questions on average for those with automatic advancement versus .71 unanswered questions for those with manual advancement), but for those using a desktop, the difference was significant: .83 questions for those with automatic advancement, and 1.06 questions for those without.
In terms of breakoff rates, that is, respondents who consented to the survey and reached at least the first page of questions but did who not reach the survey closing page, there were fewer breakoffs for those with automatic advancement than for those with manual advancement, but this difference was not significant (N=21,144, 13.99% breakoff rate for automatic advancement versus 14.68% for manual advancement).
User satisfaction
We asked all students who participated in the post-survey evaluation (N=1,300) two questions. For the first question, “Considering factors like ease of navigation, ease of reading the screen, and ease of selecting responses (but not question content), please rate how easy it was for you to complete this survey” (7-point scale with 1 = Not at all easy, 7 = Very easy; N=1,246), those exposed to the automatic advancement design rated it significantly easier for completing the survey: 6.49 for those with automatic advancement versus 6.36 for those with manual advancement (p = .035). For the second question, “How would you rate the visual design of the survey?” (4-point scale with 1 = Excellent, 4 = Poor; N=1,292), those exposed to the automatic advancement design rated it higher in terms of visual design: 1.54 versus 1.64, respectively (p = .008).
We asked respondents who received the automatic advancement feature (N=642) two additional open-ended questions: “What, if anything, did you like about the automatic advance feature?” (N=197), and “What, if anything, did you dislike about the automatic advance feature?” (N=170). These responses were coded by one of the authors by hand, with 10% of those codes then coded again and checked for agreement by another of the authors. There was agreement for all codes checked. Coding yielded a total of 10 categories for features respondents liked about the design, and 11 categories for what they disliked. The top four facets of the design that respondents liked were that the survey went faster or flowed better; that the survey was easier to answer, convenient, or efficient; that they did not have to scroll; and that the design helped them focus on and answer questions, ensuring they did not miss any questions. The aspect of the automatic advancement design that respondents stated they liked the least was that scrolling back to previous questions was a problem, or that they could not go back and change their answers. Over one-third of those who responded commented along these lines of having difficulty changing answers (N=61). However, there was nothing in the programming that prevented respondents from going back and changing any answers. If a respondent did want to change an answer on the same page, s/he simply had to scroll up to the question. If they wanted to change an answer on a previous page, s/he had to use the browser’s back button and scroll within that page. It appears that the design itself convinced some respondents that changing earlier answers was not a possibility. A few of these respondents did show evidence of figuring out that they could go back and change answers, but even then, some found it cumbersome to do.
Changing answers
As a result of our open-ended evaluation, we decided to examine the effect of the automatic advancement treatment on the number of answers changed by respondents. Our decision to investigate this was further bolstered by the recent findings of Selkälä and Couper (2017), who reported that respondents who received their automatic advancement experimental condition changed answers at a significantly reduced rate compared to those in the control group.
Our paradata provided data on all answer changes made by respondents. As a result, we were able to construct a dummy variable for each question that indicated whether respondents changed their initially selected answers for that particular question. This includes those respondents who changed an answer but ultimately decided to return to their initial choice.
We modeled respondent-level counts of the number of changed answers. Our specifying equation is of the form:
where Yi is a count of the number of changed answers for each respondent i; AutoAdvance is a dummy variable indicating experimental treatment assignment; Response is a vector of variables related to the survey response itself that are expected to affect changed answer counts, including the choice to take the survey on a mobile device and the maximum number of pages submitted per respondent; Cognitive is a vector of proxy variables for aptitude and familiarity with technology, including LSAT scores and undergraduate grade point average; and X is a collection of fixed effects for ethnicity, gender, year in law school, and the law school attended.
We tested two different response variables: (1) a count of the number of changed answers per respondent for the core and (2) a count of the number of changed answers per respondent for all pages submitted by the respondent. Since our response variables are count variables, we constructed models using both Poisson regression and the less restrictive negative binomial regression procedure.
As seen in Table 4, coefficient estimates for the automatic advancement treatment remained stable across the four models. The coefficient estimate for the automatic advancement variable represents the causal impact of receiving the feature on the count of changed answers per respondent. The coefficient estimates suggest a large depressing effect on the number of changed answers per respondent, approximately 45%–48% fewer changed answers. Figure 2 demonstrates that the average numbers of changed answers remained consistently lower for those who received the automatic advancement treatment as the survey progressed.

Discussion
Overall, we are encouraged by the results of our automatic advancement experiment. There was little significant impact in terms of the data quality indicators of straightlining, item nonresponse, and breakoff rates, and for the most part, respondents found the design to be more satisfying. We note that although the difference in satisfaction between designs was statistically significant, for practical purposes, it is not particularly great. As users become savvier and technology advances, survey researchers have more tools of increasing sophistication at their disposal. Our finding of depressed changed answer counts, however, cautions us that application of new features must be thoroughly tested and that it is possible to move too quickly in implementing new features in a web survey context. These considerations are in line with Antoun et al.'s (2017) recommendation about automatic advancement designs.
The depressed changed answer count finding is consistent with Selkälä and Couper’s work (2017:15), which concluded that “the extra effort of returning to a previous item is higher for respondents in the auto forwarding condition and may dissuade them from going back.” However, our open-ended responses offer an alternative explanation. The problem might not be the extra mental or scrolling effort, but rather that the design of the automatic advancement feature led some respondents to believe that that they could not go back and change a previously answered question. Future designs in this area may need to include clear instructions or a warning to confirm that respondents know that they can change answers if they wish.
Our data also illustrate the issue raised by Antoun et al. (2017) of the importance of user learning. The American Association for Public Opinion’s (AAPOR) report on the use of mobile technologies notes that societal learning will play a key role in how best practices are developed. AAPOR also notes that studies even just 1–2 years apart may find vastly different results as the general populace becomes more comfortable with both mobile devices and taking surveys online (American Association for Public Opinion Research 2014). While our qualitative data indicated that some users did get a better sense of the automatic advancement feature as they progressed, Figure 2 shows a consistent gap in changed answers throughout the core six pages of the survey. Future research should further investigate how respondent experiences with automatic advancement or similar features evolve over the course of a given survey or over repeated administrations of a survey instrument.
Finally, it is important to note that our experiment was conducted exclusively with law students. There could be certain unobserved characteristics within a person (motivation, attention to detail, etc.) that could be correlated with both the decision to attend law school and our measures of interest. We look to future experiments in which automatic advancement features can be tested with a more generalizable population of survey respondents.
T-tests revealed no significant differences between the two groups across a number of demographic characteristics, indicating that the randomization was successful.
The survey is part of the Indiana University Center for Postsecondary Research, where its project manager and research analysts also reside. The Indiana University Center for Survey Research is a partner providing programming, testing, recruitment, administration, and data compilation support for the survey.
The seventh page is demographic questions. A school may then elect to append up to two additional question sets, which sometimes change year to year, on different topics such as library use or student stress. The survey was custom coded in Adobe ColdFusion 11, SQL Server 2012, and the automatic advancement function was coded in JavaScript using jQuery framework (2.2.4). The survey is administered only in English.
For a visualization of our automatic advancement feature, follow this link: (http://go.iu.edu/21Ar)
We urge caution when interpreting the results for differences in duration times. Since our automatic advancement feature scrolled the screen down for the respondent rather than instantly displaying a new question, a given treated respondent’s duration time is partly a function of how fast our automatic advancement measure scrolled the screen down for them. Our finding is consistent with the broader literature that automatic advancement measures do not have a consistently clear effect on survey duration times.