
1. Background
Self-administered mail contact surveys are becoming increasingly popular given persistently decreasing response rates to telephone surveys. Modern mail contact surveys often utilize an address-based sampling (ABS) frame (American Association for Public Opinion Research 2016; Iannacchione, Staab, and Redden 2003) to cover the study area, which is derived from the United States Postal Service’s (USPS) Computerized Delivery Sequence (CDS) file. With each address on the ABS frame serving as a proxy for a household, mail correspondence can be sent to a random selection of addresses with a paper copy of the questionnaire and/or instructions for how to access the survey instrument via the web, perhaps with additional instructions on who within the household should complete it (Olson, Stange, and Smyth 2014). This sampling and data collection protocol can be adopted for the vast majority of addresses on the CDS that maintain a one-to-one relationship with a household. An address type on the CDS that presents challenges is a drop point (USPS 2017), defined as a single delivery point or receptacle that services multiple households. Drop point addresses have no unique apartment or unit designation within the CDS. All that is known is how many units the drop point includes. Nationwide, roughly 1.5% of addresses are drop points, yet rates can breach the double digits in areas where they are highly concentrated, such as Boston, New York City, and Chicago. An interactive tool for visualizing county-level concentrations of drop points can be found at https://abs.rti.org/atlas/drops/viz.
Numerous strategies have been proposed to handle drop points in self-administered mail contact surveys. These range from accepting the risk of coverage bias and eliminating them from the ABS frame altogether, or at least eliminating those larger than some prespecified threshold (RTI International 2021), merging on partially complete unit information (Kalton, Kali, and Sigman 2014) from supplemental data sources such as the No-Stat file (Shook-Sa et al. 2013), or substituting the sampled drop point with the nearest non-drop point address (Harter, McMichael, and Deng 2022; Lewis, McMichael, and Looby 2023). Amaya (2017) identifies two other options: sampling all units within the selected drop point or selecting a subsample of units within the selected drop point. Amaya goes on to speculate how a potential downside with the first strategy is that occupants seeing more than one of the same correspondence may be more prone to deem it a mass mailing and ignore without opening, whereas a risk associated with the second strategy is that occupants may “pass the buck” to another resident, in essence exhibiting diffusion of responsibility behaviors (Barron and Yechiam 2002), since the mailing was not explicitly addressed to himself or herself. To the best of our knowledge, these hypotheses have never been tested. In an effort to help fill this research gap, an experiment was conducted during the 2021 Healthy Chicago Survey (HCS) whereby a portion of drop points was sent a single survey invitation while the complementary portion was sent 2, 3, or 4 survey invitations, depending on the number of units existing at the drop point. The former we refer to as the “mail to one” strategy, whereas the latter we refer to as the “mail to all” strategy. This paper reports on the results from that experiment.
2. Data and Methods
Data analyzed in this paper were collected during the 2021 administration of the HCS, a survey launched by the Chicago Department of Public Health in 2014 as an annual, dual-frame, random-digit dial (DFRDD) telephone survey of adults in Chicago. The HCS transitioned into a mail contact, self-administered, web/paper data collection mode survey using the “next birthday” method for within-household selection (Olson, Stange, and Smyth 2014) and an ABS frame beginning with the 2020 administration (Unangst et al. 2022). Data from the survey have been used to support the implementation of Healthy Chicago 2.0 (https://www.chicago.gov/city/en/depts/cdph/provdrs/healthychicago.html) and to shape a range of public health interventions and policies to mitigate health inequities.
The 2021 HCS was administered between June 14 and November 30, 2021. The ABS frame developed for the survey consisted of 1,207,642 addresses. Of these, 146,711 (12.1%) were addresses in drop points containing between 2 and 4 units, while the remaining 1,060,931 addresses were not associated with a drop point. To simplify data collection logistics, we excluded 10,871 addresses from drop points containing 5 units or more, which are relatively rare and, as Amaya et al. (2014) points out, are often gated communities, high-rises, trailer parks, or alternative housing arrangements that present additional data collection challenges.
Overall, a sample of 18,488 addresses was selected in the 2021 HCS with the goal of obtaining a minimum of 4,200 completes citywide and at least 35 completes within each of 77 mutually exclusive and exhaustive community areas (i.e., sampling strata) that constitute the study area. Addresses were allocated into one of two sample releases fielded in succession. The first began on July 19—following a small-scale pilot sample release that launched on June 14—and the second began on September 15. Initially, a total of 2,196 addresses from drop points were selected. In the first release, we employed the “mail to all” strategy in which we sent either 2, 3, or 4 survey invitation packets to the drop point, depending on its size. The survey invitation packet sent contained a $2 pre-incentive, a paper copy of the questionnaire, and information regarding how it could be completed via the web. Following the Choice+ methodology discussed in Biemer et al. (2018), a $10 post-incentive was promised for completing the survey by paper, and a $20 post-incentive was promised for completing the survey by web. In the second release, the same survey packet materials and pre-/post-incentive amounts were utilized, but we instead employed a “mail to one” strategy in which a single survey packet was sent to the drop point. Note that for non-drop point addresses, three additional reminder mailings were sent. But since targeted follow-up correspondence is impossible without unique apartment or unit numbers, a single survey packet was all that was sent to the drop point addresses. In all, 1,787 survey packets were sent out as part of the mail to all strategy and 1,403 were sent out as part of the mail to one strategy. To account for the fact that the two strategies were applied on two different samples with differing sampling rates eight weeks apart, all percentages reported in this paper have been calculated using base weights.
3. Results
Table 1 presents the counts of disposition codes and corresponding base-weighted percentages for the two drop point experimental conditions. Interestingly, we find the mail to one strategy garners a higher yield rate than the mail to all strategy (14.5% vs. 11.4%). A comparable gap prevails with response rates. The AAPOR RR3 calculation (AAPOR 2023) for the mail to one strategy comes out to 16.6%, whereas that figure is 13.3% for the mail to all strategy. Overall, this 3.3 percentage point difference is large enough to be statistically significant (t = 2.63; p < 0.01), but the effect is a little weaker in DPs with 2 units versus those with 3 or 4 (2.4 versus 4.2 percentage points, respectively). While counts of partial completes and undeliverables are not large enough to make meaningful comparisons, one can note from the table that there are no discernable differences across the two conditions. Another noteworthy finding is that, under the mail to all condition, 134 of the 206 web and paper completes came from a unique drop point. So, multiple completes from the same drop point account for 35% of the total number of completes. Although sample sizes are relatively small, we have no evidence of this number varying much depending on whether the drop point was comprised of 2, 3, or 4 units.
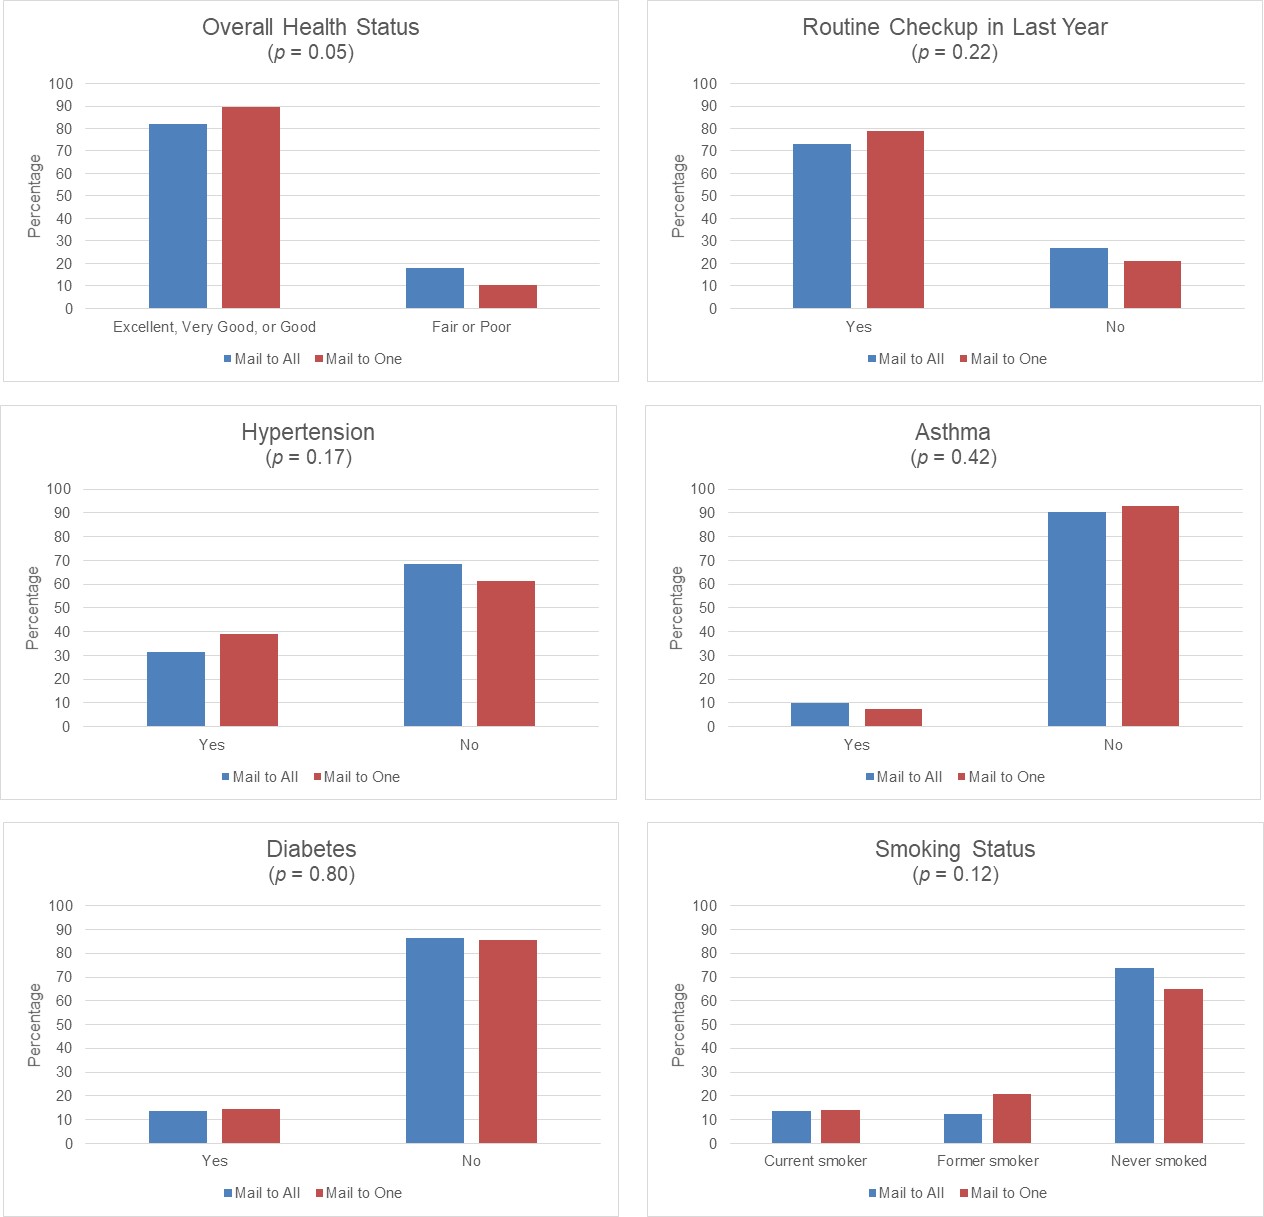
In addition to data collection performance statistics, we compared across the two drop point experiment conditions the base-weighted distributions of the same demographic and key health outcome variables analyzed in Unangst et al. (2022). These are presented in Figures 1 and 2, respectively. Unangst et al. (2022) presented tabular comparisons of roughly one dozen demographics and key health outcomes, but for brevity, we present six of each in this paper via grouped bar charts. The p-value from a Rao-Scott chi-square test of independence (Rao and Scott 1981) is provided in parentheses underneath each variable title.


With respect to the demographic variables, the mail to one condition tends to generate more completes from older individuals, women, and those who own their home. On the other hand, no noteworthy patterns emerge for respondent race/ethnicity, educational attainment, and the presence of children in the household. For the key health outcome distributions shown in Figure 2, only one’s self-rating of overall health is marginally significant, with roughly an 8 percentage point difference between those who self-rate themselves as being in excellent, very good, or good health. Distributions on smoking status, whether one has had a medical checkup in the last year, and whether one has ever been diagnosed with hypertension, asthma, or diabetes are very similar across the two drop point experiment conditions.
4. Summary
Practitioners utilizing ABS frames in self-administered, mail contact surveys must decide how to handle drop points. A variety of strategies are used in practice, including the two competing methods discussed in Amaya (2017): (1) sampling all units at the drop point or (2) subsampling a portion of them. This paper aimed to provide insight into whether there were any substantive differences between those two approaches. Specifically, we reported results from an experiment fielded during the 2021 HCS in which drop point addresses were treated in one of two ways across two subsequent sample releases. In the first, a mail to all strategy was employed to effectively sample all units at drop points consisting of 2, 3, or 4 units. In the second, a mail to one strategy was utilized to effectively subsample just a single unit at the drop point.
Our findings can be summarized as follows. The mail to one strategy produced a roughly 3 percentage point increase in response rates. This difference was somewhat more pronounced in three- and four-unit drop point addresses than those consisting of two units, suggesting any potential diffusion of responsibility effect is reduced in latter scenarios, where there is only one other unit/individual upon which to “pass the buck.” Base-weighted distributions of demographics were disparate enough to be statistically significant in some instances—specifically, for respondent gender and age—yet none of the base-weighted distributions of key health outcomes differed significantly. All in all, these results suggest that a mail to one strategy is more efficient than a mail to all strategy.
To be sure, more research is needed to support these findings, especially considering our study’s limitations, which we acknowledge in closing. For one, our study focused on one major metropolitan area of the United States, and with relatively small (analysis) sample sizes. Furthermore, we did not evaluate a “middle ground” condition to subsample more than one but fewer than all units at the drop point. Given that, nationally, 80% of drop points are comprised of 2 units (Amaya 2017), however, that approach would likely not differ much relative to the two conditions we did evaluate. Last, we did not compare these two approaches in a wholistic manner (e.g., with respect to citywide estimates including nondrop point addresses) against other alternatives such as exclusion or substitution, but forthcoming research will do so.
Disclaimer
The conclusions in the paper are those of the authors and do not necessarily represent the views of the Chicago Department of Public Health.
Author Contact Information
Taylor Lewis
701 13th St., NW
Suite 750
Washington, DC 20005
thlewis@rti.org
202-728-1940