Introduction
The current study aims to add to the literature on mode effects. Specifically, we investigate and present results related to mode effects’ relationship with the response patterns and the demographic make-up of respondents randomly assigned to phone and text-to-web survey administration groups.[1]
Mode effects are the differences in responses to a survey or survey questions attributable to the survey administration mode. Non-observation effects refer to who responds to different modes and observation effects refer to how respondents respond to questions presented via a given mode (DeLeeuw 2018). This study explores both non-observation and observation effects for text-to-web and phone survey administration.
Several factors may cause differential observation effects between phone and text-to-web survey respondents. Phone surveys rely on aural and web surveys rely on visual attention. This is significant for multiple choice questions with several options, where web respondents are presented with options. Phone interview staff typically may ask a question and record a response without reading all response options. Additionally, an interviewer can ask probing questions or rephrase the survey questions and thus influence responses. Studies have found that the interviewer’s personality, social skills, and rate of speech may impact survey cooperation and the rate of survey completion.
A respondent’s willingness to provide responses and share negative responses may also relate to survey mode. For example, a Pew Research experiment in 2015 found that online surveys yielded more negative views of politicians than phone surveys (Keeter 2015). And the presence of an interviewer may cause a respondent to censor or alter their responses to be viewed more favorably (Tourangeau and Yan 2007). For a thorough synthesis of interviewer effects, see West and Blom (2016).
Web respondents may be presented with “Don’t know” or “Prefer not to say” for each question, whereas phone respondents may not specifically be read these as options for each question, though interviewers may accept these as choices. A Public Opinion Quarterly study found that a web questionnaire produced less nonresponse compared to a phone survey (Fricker 2005). Further, in a random-assignment experiment that used voter roles in Florida, researchers found that uncertain respondents were more likely to respond “Don’t know/Refuse” in phone interviews than web respondents (Enrijeta, Martinez, and Binder 2022). This study noted that for the questions being compared, “Don’t know” responses were not explicitly offered in either mode, but it was accepted as a voluntary response on the phone. On the web, if a respondent wished to avoid answering a question, they could skip to the next question.
Regarding non-observation effects, the mode of survey administration may impact the demographic distinctiveness of respondents. Some members of the population may be more prone to answer a phone call than others. Conversely, others may read and respond to emails religiously, while others may rarely open emails. Some individuals may be less prone to answer a web-based survey because of familiarity with technology.
Beyond habits, differential access to technology may be the basis for non-observation effects. Specifically, access to internet-enabled smartphones is a relevant issue for this study. Recent Pew Research indicates that though smartphones are ubiquitous, lower income individuals own them at a lower rate. Eighty-five percent of Americans indicated they owned a smartphone in 2021 (Pew Research Center 2021). However, 24% of adults with household incomes below $30,000 a year said they do not own a smartphone compared with 3% of individuals with incomes over $100,000 (Vogels 2021).
Methods
To gather feedback from participants in a home energy efficiency program in the Southern United States, we administered a survey over two weeks in August 2021. We randomly assigned 1,509 program participants to either a text-to-web (750) or a phone call group (759). All program participants were included, and the survey was administered in English. The text message included a link that participants could use to access the online self-administered version of the survey. Both groups were offered a $10 incentive (either digital or physical gift card) that was conditional on completing the survey. We did not perform any pre-cleaning or vetting of the data to remove landlines or non-functioning numbers for two reasons. First, the home energy efficiency program’s staff informed the evaluation team that most participants used cell phones. Second, the cost of online services that assist with pre-cleaning or vetting phone number lists for landlines exceeded the cost of sending SMS text message invites to all contacts in the list.
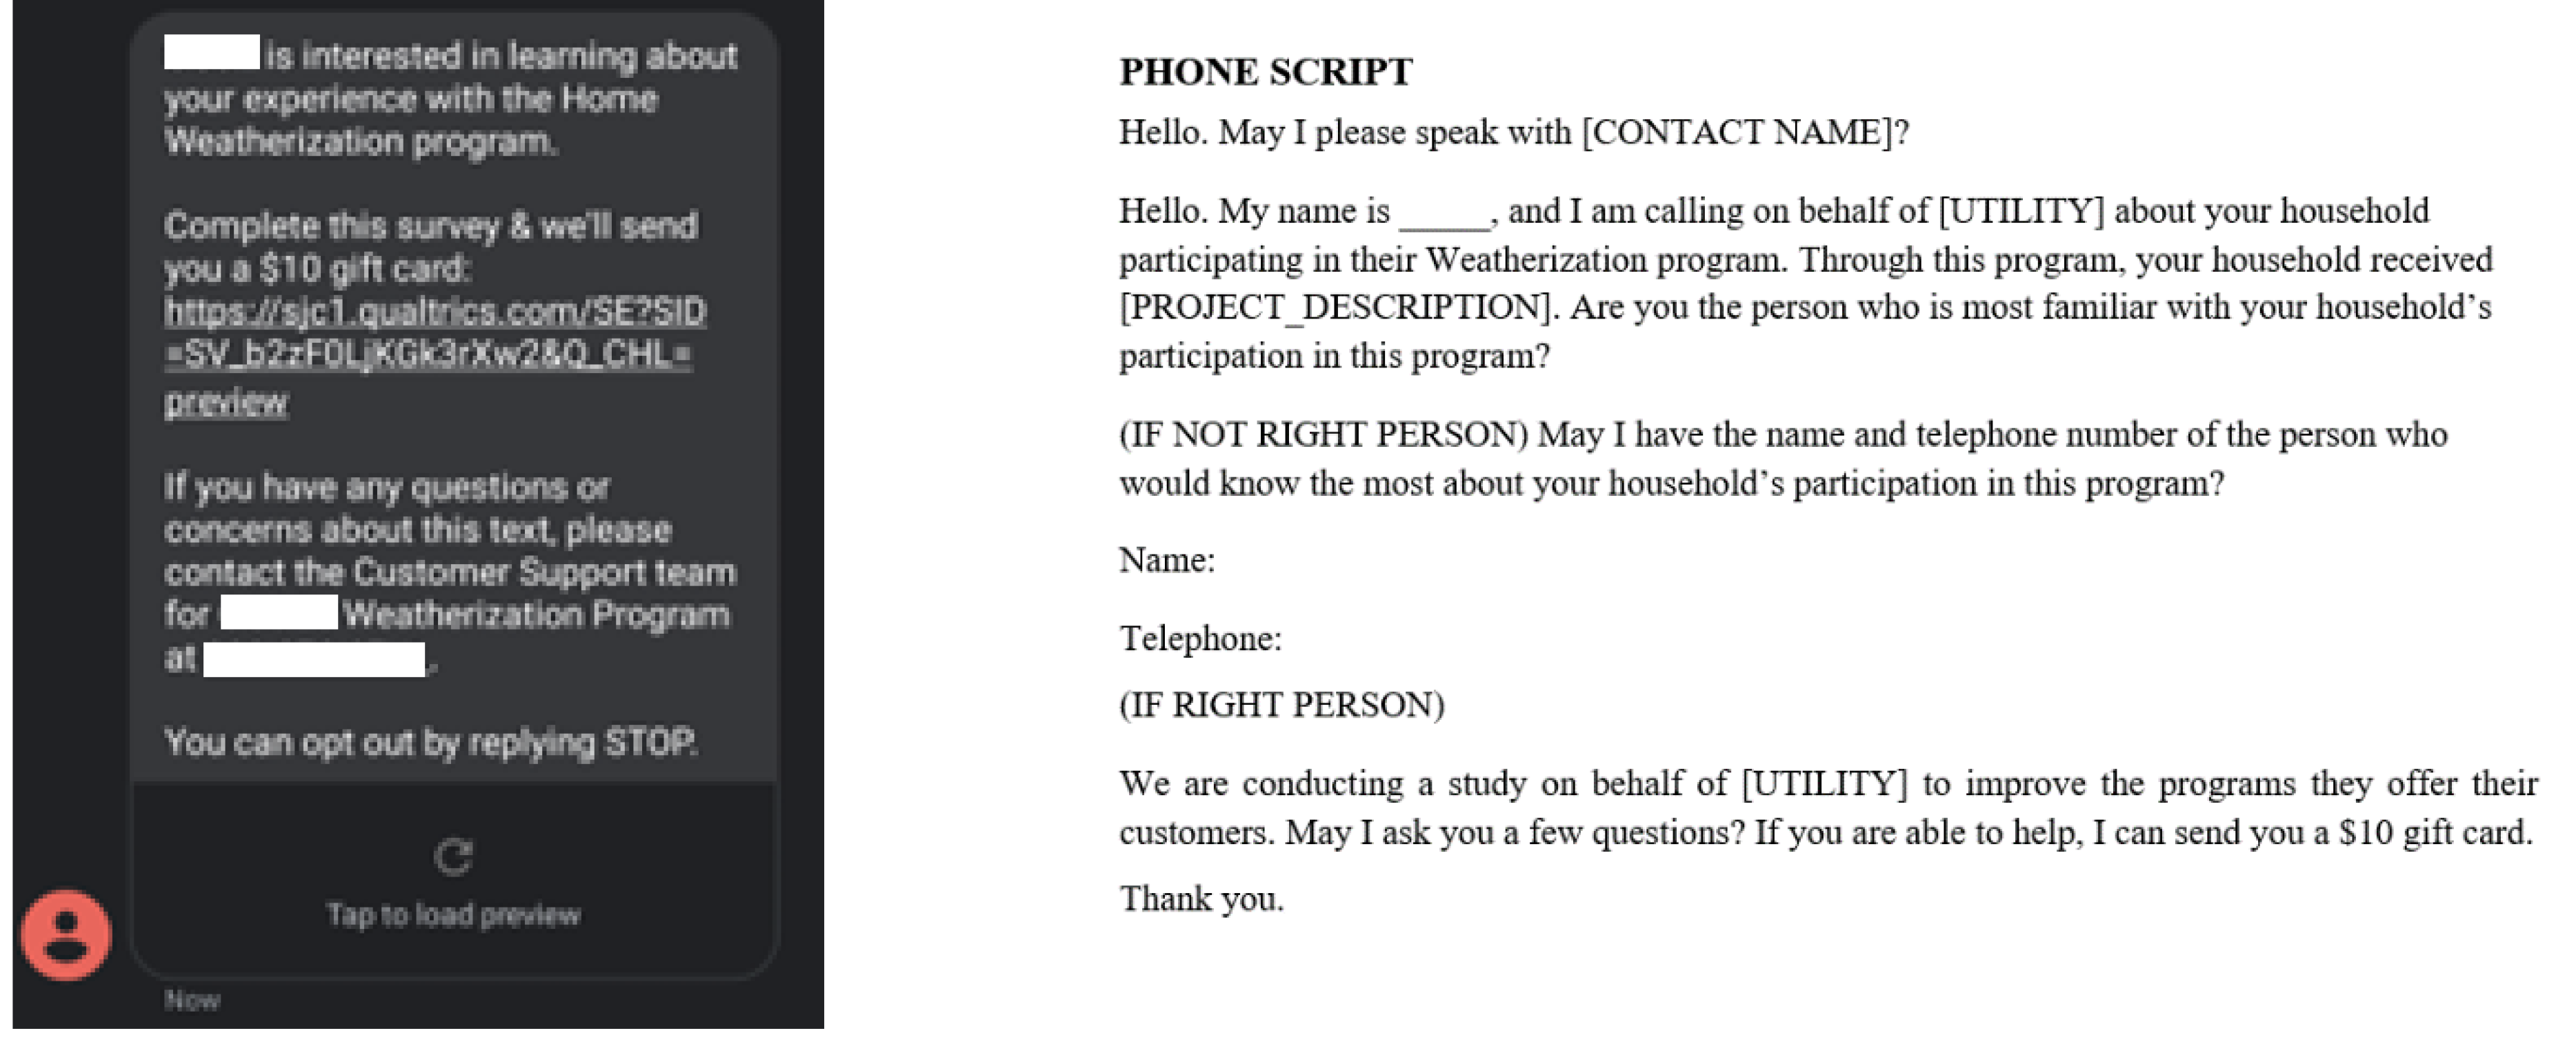
The survey recruitment styles were similar, but given the different mediums, the language differed. Text-to-web group customers were sent one message. Call staff were instructed to call phone recruitment customers once and leave a message. Sixteen respondents either called back to complete the survey or requested a callback and thus received two phone calls. Call staff were provided additional instructions if customers had questions regarding the survey or the background on the study. See Figure 1 for the text-to-web and phone recruitment messages.

Results
Table 1 displays information on survey sampling, recruitment, and response rates. About 11% of the text survey invitations bounced, and similarly call staff recorded about 11% of phone numbers on the call list as disconnected, having technical issues, or being the wrong number. Though the text-to-web survey had a higher response rate, the difference was not statistically significant. The response rate was calculated by dividing the total completed surveys by the number of unique phone numbers called or texts sent, fewer disconnected numbers or bounced SMS invites. For the text-to-web group, this was (162/(750-84)), and for phone call group, it was calculated as (115/(590-67)).
Researchers did not maintain detailed administrative cost information for this survey effort. However, we can estimate the cost of text-to-web as significantly lower than phone administration.
To estimate costs, first, we investigated the average response time. The survey collection tool collected the start and submission date and time. For both text-to-web and phone responses, it appears some responses were not submitted promptly at survey completion (i.e., the survey-taker or survey administration staff may have failed to hit submit immediately after they had completed the survey). To address this, we removed 18 respondents’ response times that were determined to be outliers. We used the Interquartile Range (IQR) to determine outliers. Any value that was 1.5 x IQR greater than the third quartile was designated as an outlier. Fifteen text-to-web (9%) and three phone (3%) response times were removed. After this preliminary step, we found a median survey response time of nine minutes and an average response time of 10 minutes and 34 seconds. The average text-to-web survey response time was about 2 minutes longer than the average phone survey response time. The questions used in this study were in the latter half of the survey, with the demographic questions being the final section.
We estimate the total time needed to complete phone survey administration was 118 hours. With a call center hour valued at $60, the cost of phone survey administration was about $7,000. This estimate was based on the average phone completion time (9.5 minutes), total completes needed for this survey, total phone numbers on the call list, average attempts needed for a complete, and an estimated amount of time for a non-complete survey (2 minutes). Here is the formula used for this estimate:
((Completion time*Total Completes)+(Total Phone Numbers*Average Attempts Needed for Complete*Time For a Non-Complete))/60
Currently, the survey administration software charges $0.08 to send a text-to-web invite in the United States. Excluding testing and other administrative costs, it would cost about $60 to send invites to the text-to-web group.
We asked the two groups for personal (Table 2) and home (Table 3) background characteristics. Statistically significant differences are denoted with asterisks.[2] There were statistically significant differences between the race characteristics of the two groups. There were no statistically significant differences between the two groups reported home characteristics, gender, or employment status.
For ordinal-level variables (age, income, education, home square footage, household size, and home age), we examined relationships using both z-test and through Mann-Whitney U tests and did not find meaningful differences between the groups. Though we found statistically significant differences between two subgroups’ age characteristics using z-tests, the Mann-Whitney U tests did not yield statistically significant results and did not suggest differences between the text-to-web and phone call groups’ age, income, or education. Similarly, z-tests did not indicate significant differences between the text-to-web and phone call groups’ household size and home age, but there were significant (though very weak) differences found using the Mann-Whitney U tests. Neither z-tests nor Mann-Whitney U tests were significant for home square footage.
We examined whether income, education, age, and employment status were related to response mode. We did not find any statistically significant relationships with income ($60,000 or greater vs. less than $60,000), education (college vs. no college), or employment status (employed vs. not employed).
When we grouped by age, we found that younger participants were more likely to respond to the text-to-web survey, whereas customers in the middle age bracket were more prone to respond to a phone call survey. Twenty percent of text-to-web and phone respondents identified as being under 35 years old, compared to 11% of phone-call respondents. This compared to 43% of phone call versus 27% of text-to-web and phone respondents that identified as being between 35-54 years old. The portion of respondents identifying as older than 55 was similar in the two survey modes (52% text-to-web, 46% phone call).
We also noted that the portion of respondents who responded “Prefer not to say” or “Don’t know” to background and demographic questions differed by survey response mode. Table 4 displays the portion of respondents that preferred not to respond to demographic questions and displays statistically significant differences with asterisks. These questions did not offer “Don’t know” as an option for either survey mode. Phone call respondents were not explicitly offered a “Don’t know” or “Prefer not to say” response, though they were informed that demographic questions were optional, and they could choose not to respond at the beginning of the demographics section.
For background information questions, we found that the portion of respondents that selected “Don’t know” was similar across modes, but a larger portion of phone call respondents did not know or could not recall the square footage of their home compared with the text-to-web survey respondents. This may indicate that text-to-web survey respondents were more willing to provide home information or invest the time to consider the appropriate answer before providing a “Don’t know” response. Table 5 displays the portion of respondents that did not know or were unable to recall home information.
Finally, we investigated whether survey administration mode was related to reported satisfaction with program experience. Consistent with other research, we found that text/online, self-administered survey respondents were more prone to share negative feedback than phone call survey respondents (Table 6).
Discussion
There are multiple practical implications of this study.
First, conducting text-to-web and phone versions of a survey of low-income weatherization program participants yielded respondents with generally similar background characteristics. Though we noted some non-observation effects, our results challenge conventional thought regarding age and technology adoption/utilization. Recent studies show tech adoption has increased among older adults. However, younger generations still tend to own and use smartphones and social media at a higher rate than older adults (Faverio 2022). The difference in the age of respondents in the text-to-web and phone survey modes generally aligns with current statistics, though it is noteworthy that the portion of respondents identifying as older than 55 was similar in the two survey modes in this study. This is consistent with recent findings that suggest that technological barriers have lowered and familiarity has grown with the internet. Researchers have found that self-administered web surveys could be effective in targeting retirement age people (Kelfve et al. 2020).
The racial/ethnic difference between text-to-web and phone respondent groups is noteworthy because, though differences persist in-home internet access, there are no statistically significant racial/ethnic differences when it comes to smartphone or tablet ownership in the United States (Atske and Perrin 2022).
Second, text-to-web survey administration may be an effective, low-cost recruitment strategy. This study highlighted the success of text-to-web as a recruitment method. The response rate was slightly higher for text compared to phone recruitment (though the difference was not statistically significant). Laws may prohibit the use of text recruitment for surveys. However, in scenarios in which companies are permitted to, or may have even established histories of contacting customers via text, this study shows that it could be a cost-effective and timely way to collect data compared to interviewer-led phone calls.
Regarding observation mode effects, we found evidence that phone respondents had more item non-substantive response for several demographic questions and one background question. Though we cannot say with certainty the reason for this difference, one potential reason for this difference is privacy. The presence of an interviewer may have caused phone respondents to opt not to share information on demographic and background questions that they perceived as sensitive, while the lack of an interviewer imbued text-to-web respondents with a greater sense of information privacy. Similarly, self-administered text-to-web survey takers were more prone to provide negative feedback than phone group respondents. These findings are consistent with our own past research on item non-substantive response (Soszynski and Bliss 2022) and other studies on interviewer effects on socially desirable responses (West and Blom 2016). Phone respondents may prefer not to share certain information with an interviewer as they do not want to be perceived as negative; the lack of an interviewer enables text-to-web respondents to share their opinions more freely without concern for the immediate judgment of a third party.
We recognize that a lack of benchmarking data or underlying information regarding the population is a weakness. Thus, both modes could potentially underrepresent or overrepresent certain groups, leading to similar but somewhat biased samples. Additionally, though the sample size for both the text-to-web and phone call groups were reasonably sized and large enough to meet 90–10 precision for the population of interest (program participants), this study’s generalizability may be limited as it was conducted on a unique population. The population of study here was low-income customers that had signed up for a utility-run home weatherization program in the Southern United States. Despite these limitations, the randomized-control design gave this study strength and make its findings worth sharing.
Finally, while we recognize that no survey approach guarantees achieving demographic representativeness, limited evidence of non-observation effects between the two modes may suggest that a mixed-mode approach may not increase the likelihood of achieving that goal.
The practical implications of these findings are multiple. First, if possible, text-to-web may be an inexpensive and effective way to gather survey responses. Second, limited evidence of non-observation effects between the two modes may suggest that a mixed-mode approach may not be necessary to ensure demographic representativeness. However, a caveat to this takeaway is that the phone mode gathered less negative feedback.
Thus, depending on the context, constraints, and goals of a research effort, a mixed-mode approach may be appropriate. This study’s results suggest researchers would be wise to continue to consider mode effects and their potential to impact sample composition as well as the data collected through survey research efforts (and subsequently if and how these impacts should be accounted for in the empirical analysis and reporting of results).
Text-to-web administration refers to sending survey invitations with links to a web-based data collection tool via SMS text message.
Asterisks indicate statistical significance between survey modes at p <0.05 using two proportion z-tests or Mann-Whitney U tests.