
Introduction
Challenges of using telephone surveys in population surveillance include rising costs and declining response rates (Dutwin and Lavrakas 2016). The American Association for Public Opinion Research (AAPOR) released a task force report that showed a growing preference for self-administered methods over interviewer-administered surveys and indicated that many surveys have changed from random-digit dialing (RDD) to address-based samples (ABS) (Olson et al. 2021). Web-based interviews have been shown to ease challenges such as cost, completion time, or declining response rate; however, it is unclear which method is the best alternative to traditional interviewing (Hays, Liu, and Kapteyn 2015; Langenderfer-Magruder and Wilke 2020).
The Behavioral Risk Factor Surveillance System (BRFSS) is a state-based, random-digit-dial, telephone survey used to assess health-related risk behaviors and chronic health conditions among U.S. adults (Centers for Disease Control and Prevention 2021a). Compared to some large surveys, the BRFSS has a relatively strong response rate (Centers for Disease Control and Prevention 2021b), but costs and other factors have prompted the review of data collection methods and sampling strategies. In the past, BRFSS has conducted pilots (Pierannunzi et al. 2019) resulting in protocol modifications. In 2020, the Centers for Disease Control and Prevention began pilots to test alternative protocols that could supplement BRFSS. Pilots using internet panels, ABS push-to-web, and RDD short-message-service (SMS), each using different sources of samples and methods, were completed by Texas participants in 2021. Using BRFSS data, our study offers insight into differences in sample composition, response rates, and costs across protocols. Our primary objective was to evaluate the three pilots by comparing 1) demographic characteristics among pilot respondents, BRFSS respondents, and American Community Survey (ACS) data, 2) differences among responses for health-related measures, and 3) differences in costs per completed interview.
Methods
Texas has diverse urban and rural substate regions, providing an opportunity to sample hard-to-reach populations (Brannen 2023). Two of the pilots (RDD SMS and internet panel) included subjects from multiple states; we extracted responses for Texas residents from the data of these two pilots. The ABS push-to-web was conducted only in Texas.
Survey Protocols
Figure 1 provides a summary of data collection and recruitment methods. We used BRFSS data, collected from January to June 2021, using Computer Assisted Telephone Interviews (CATI), for comparisons with pilots. An interviewer made up to six call backs and administered the BRFSS without respondent incentives. The final sample was 3,140 respondents.

The RDD SMS text pilot was conducted November 10–December 17, 2021. The RDD sample was purchased from a vendor specializing in sampling populations. Text messages including an invitation and link were sent to 41,662 RDD cell phone numbers. One to two text reminders were sent, and participants were offered a $5 monetary incentive upon completion. The final sample was 493 respondents.
Participants in the ABS push-to-web pilot completed surveys April 28–June 30, 2021. They were recruited using a random sample of 14,000 residential addresses from the United States Postal Service (USPS) delivery sequence file. Each potential respondent was mailed an invitation with a prepaid $2 incentive and link to the online survey. Non-respondents were mailed up to four reminders. The final sample was 2,804 respondents.
The internet panelists were taken from a commercially available probability-based internet panel sample. Panelists were emailed up to four reminders. They completed the survey July 9–August 22, 2021. The sample of 1,727 respondents received incentives regularly provided by the panel. The final sample was 1,017 respondents.
The pilots used a subset of questions from the 2021 BRFSS questionnaire (Centers for Disease Control and Prevention 2021c). All protocols except RDD SMS had Spanish questionnaires available to respondents.
Sample Composition
Because our interest was to compare the demographic distribution of the respondents by protocol, rather than to estimate population prevalence, we calculated unweighted percentages of sociodemographic characteristics and used the 2021 ACS weighted estimates for Texas (U.S. Census Bureau 2021) to examine descriptive representativeness. We compared differences in unweighted percentage points between protocols and ACS estimates. For each demographic, the dissimilarity index was calculated as the sum of the absolute difference between proportion of demographic category and proportion of ACS, divided by half, and is interpreted as the proportion of observations that would need to change categories in the samples to achieve perfect agreement with the ACS (Biemer et al. 2018).
Health Indicators
For health-related questions, we assessed responses to questions on 1) whether respondents had been diagnosed with angina or coronary heart disease and 2) whether they had received a flu shot in the past 12 months. Because wording was changed for some health-related questions to accommodate data collection methods, we focused on questions with wording identical to the BRFSS to make comparisons across surveys. We compared differences in unweighted percentage points between the three pilots and BRFSS/CATI.
Survey Costs
We performed a basic cost analysis to determine the average cost for a completed survey by method. We calculated cost per complete as the total costs of survey administration divided by the total number of completed responses. Cost per complete was provided as a range to cover varying incentives and methods, excluding administration costs.
Response Rates
Response rates, calculated by dividing the number of respondents who completed the survey by the total sample size, were difficult to compare across protocols, especially when samples were taken from several different sources for each pilot. Two response rates (BRFSS/CATI and RDD SMS) were calculated based on samples of residential phone numbers. The internet panel sampled from its recruited panel members and the ABS pilot used the USPS resident address sample.
Results
Sample Composition
Table 1 provides unweighted numbers and percentages of respondent characteristics collected by protocol along with ACS estimates of sociodemographic characteristics. Percentage point differences between protocols and ACS are presented in Table 1.
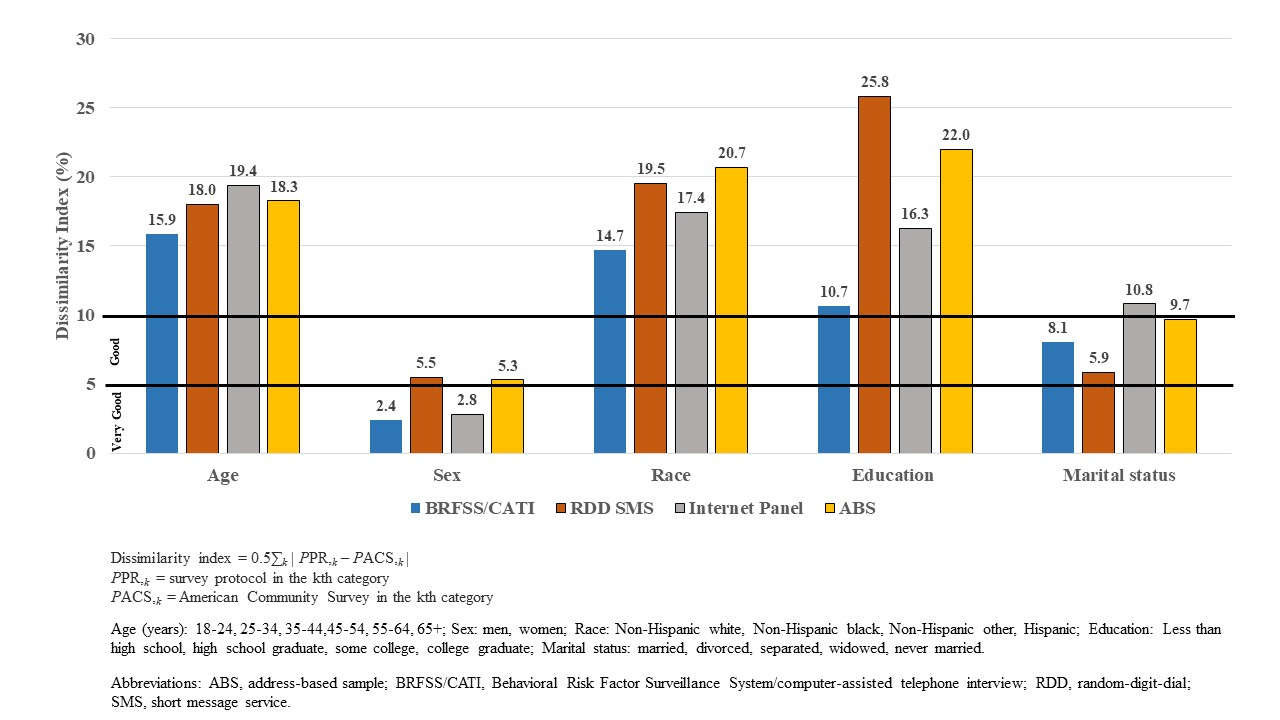
Figure 2 shows the dissimilarity index as a percentage for each demographic. Because dissimilarity indices were compared across demographics, the values may represent different levels of dissimilarity depending on the number of categories. As an indicator of agreement between protocol and ACS, indices from 10 to 5 percent dissimilarity were considered ‘good’ and ≤ 5 percent were considered ‘very good’ (Biemer et al. 2018).

Highest dissimilarity indices (> 10) were found for age, race, and education. Compared with the ACS, all protocols had lower percentages of respondents aged 18–44, and higher percentages of respondents aged 65 years or older. The highest percentage of respondents aged 18–24 was obtained by RDD SMS. BRFSS/CATI had the highest percentage of the oldest age group (65 years or older) and was 13.9 percentage points higher than the ACS.
All protocols had a higher percentage of non-Hispanic White adults than the ACS with percentage point differences ranging from 14.7 (BRFSS/CATI) to 19.3 (ABS). A lower percentage of Hispanic adults was observed for all protocols versus the ACS. Differences in the percentages of non-Hispanic minority respondents were minimal between protocols and ACS.
Compared with the ACS, distributions by education level showed that percentages of adults with less than a high school education were at least 10 percentage points lower in RDD SMS, internet panel, and ABS but only 4.5 percentage points lower among BRFSS/CATI respondents. The percentage of college graduates ranged from 10.6 percentage points (BRFSS/CATI) to more than 20 percentage points (RDD SMS and ABS) higher than ACS.
The lowest dissimilarity indices were found for sex. In all protocols, percentages of men and percentages of women were within 5.5 percentage points of the ACS. Low dissimilarity indices were also found for marital status, except for the internet panel where a higher percentage of respondents reported being married. A higher percentage of BRFSS/CATI respondents reported being divorced, separated, or widowed compared with the other pilots and the ACS. Never married respondents ranged from 5.8 (RDD SMS) to 9.7 (ABS) percentage points lower for all protocols compared with the ACS.
For home ownership, dissimilarity indices were higher for the pilots compared to BRFSS/CATI. Homeownership was higher among respondents in all protocols compared with the ACS; renting a home was lower among respondents compared with the ACS. The percentage of one-adult households ranged from 2.9 (RDD SMS) percentage points lower to 6.3 (ABS) percentage points higher than BRFSS/CATI. The percentage of households with at least three adults was 9.1 percentage points lower for ABS compared to BRFSS/CATI. We could not compare the number of adult household residents in the protocols to ACS because 1-year ACS estimates were not available.
Health Indicators
Table 2 provides unweighted numbers and percentages of respondents in each pilot and the BRFSS/CATI who answered questions about a history of coronary heart disease and flu immunization in the past 12 months.
Differences between pilots and the BRFSS/CATI for the question assessing coronary heart disease were less than one percentage point. The percentage of respondents reporting flu immunization over the past 12 months was lower for BRFSS/CATI than the pilots. The percentages of respondents reporting flu immunization in ABS and RDD SMS were 13.4 and 15.5 percentage points higher, respectively, than BRFSS/CATI.
Survey Costs
Comparing costs across protocols was challenging. In some of the pilots, costs were associated with contracts/subcontracts, which may distort operational costs. Two of the pilots were conducted in multiple states; extracting single-state costs was not possible. In those instances, costs per complete are averages across all states in the pilots (15 states for RDD SMS and 11 states for the internet panel). For all surveys, cost estimates were provided by data-collecting vendors. Range of costs for BRFSS/CATI represent landline and cell phone surveys. Expenses for web-based surveys were associated with time of contract and cost of follow-up. Cost per complete was lower among the pilots than the BRFSS/CATI. The cost per complete for BRFSS/CATI ranged from $75 to $100 compared with costs per complete for ABS ($31 to $39), RDD SMS ($12 to $20), and internet panel (approximately $25).
Response Rates
Response rates were highest for the internet panel (58%). These subjects, however, had already been recruited by the panel vendor. The BRFSS/CATI had a higher response rate of 52% compared with the ABS (20%) and the RDD SMS (1%).
Discussion
Our first objective was to compare sociodemographic characteristics of RDD SMS, ABS, internet panel, and BRFSS/CATI respondents with the ACS estimates for Texas. Our results showed notable differences between the survey protocols and the ACS estimates in age, race/ethnicity, education, and marital status. Neither the pilots nor the BRFSS/CATI obtained representative samples of persons aged 18–44 years. RDD SMS had the highest percentage of respondents aged 18–24 years. Other web-based surveys have better responses from persons aged 18–24 years versus non-web-based surveys (Kaplowitz, Hadlock, and Levine 2004; Shih and Fan 2008). Respondents aged 65 years and older were overrepresented for all protocols.
Internet panel, ABS, and RDD SMS respondents reported higher levels of education than BRFSS/CATI respondents, which is consistent with findings from a 2003 BRFSS study (Link and Mokdad 2005). Among survey respondents, the BRFSS/CATI group was closest to the ACS proportion of persons with less than a high school education, considered a hard-to-reach, socially disadvantaged group (Bonevski et al. 2014).
Characteristics of race and ethnicity differed from the ACS across all protocols. Compared with ACS, there were higher proportions of non-Hispanic White respondents and lower proportions of Hispanic respondents in all groups, whereas differences among non-Hispanic minorities appeared negligible. The lower percentages of Hispanic respondents across all protocols may be due to several barriers such as education, confidentiality concerns, fluid households, and irregular housing among Hispanics residing in Texas (O’Hegarty et al. 2010).
Lastly, we found BRFSS/CATI reached a higher percentage of households with one adult compared with RDD SMS and internet panel—another finding consistent with the 2003 BRFSS study showing a higher percentage of one adult households in BRFSS compared with a web-based survey (Link and Mokdad 2005).
Our second objective was to compare responses for health-related measures. We found minimal differences in respondents answering “yes” to the question about whether they had been told they had angina or coronary heart disease; however, more respondents in the RDD SMS and ABS indicated they had been immunized for influenza in the past 12 months when compared with the internet panel and BRFSS/CATI. Flu immunization rates are higher among adults aged 65 and over compared to younger age groups in Texas (Texas Health and Human Services 2021); therefore, these differences between BRFSS/CATI, which had a higher number of older adult respondents, and the other methods were unexpected. Other studies have reported variations in survey responses by protocol (Domche et al. 2020; McMaster et al. 2017).
The third goal of this study was to compare costs per complete between the survey methods. The cost to complete the BRFSS/CATI survey was higher than the other protocols primarily due to the cost of interviewer time and cost of sample numbers required to obtain completion (AAPOR Cell Phone Task Force. 2010; Guterbock, Benson, and Lavrakas 2018). We found that web-based surveys, including monetary incentives, were more cost-effective when compared with BRFSS/CATI. Although limited access to and use of the internet have been found primarily among older adults with lower income and education (van Deursen and Helsper 2015), all survey protocols overrepresented older age groups. It is possible that older adults who participate in web-based surveys have a higher income and education than older adults who participate in a non-web-based survey and may not be representative of all older adults. Our response rate comparisons indicate that the BRFSS/CATI outperformed RDD SMS and ABS and was comparable to the internet panel.
We made our findings under three main study limitations. First, data from all protocols were limited to Texas, which has a diverse population but may not be representative of other states or populations. Second, although response rates and costs per complete were calculated, such cross-method comparisons were difficult to perform and may not be exact. For the RDD SMS pilot, there was no clear way to determine whether potential respondents received the text invitations, and the response rates for the internet panel were based on cooperation by persons who had already agreed to be part of the panel. Third, in the absence of medical records, we cannot determine which protocol captured levels of heart disease or flu immunization most accurately.
All protocols did not obtain a representative sample and web-based surveys cost less than BRFSS/CATI. RDD SMS yielded a higher percentage of the youngest age group; it has been a challenge in previous BRFSS/CATI data collections to reach this group. Results are encouraging in that responses to selected health-related questions between pilot data and the BRFSS/CATI data are comparable. Future efforts should try to obtain a larger sample population to better assess demographic differences. Further investigation into the use of web-based surveys and ABS may lead to additional insight into best practices for incorporating these methods as BRFSS supplements.
Acknowledgements
The authors thank Carol Pierannunzi for her considerable contribution to this article. The findings in this article are those of the authors and do not necessarily represent the official position of the Centers for Disease Control and Prevention.