Introduction
The Robert Wood Johnson Foundation’s (RWJF) Culture of Health Action Framework provides a blueprint for ensuring that everyone in America has a fair and just opportunity for health and well-being (Plough 2015). According to the framework, a critical driver of population health, well-being, and equity is making health a shared value or the belief that health is a priority for oneself and one’s community (Plough 2015; Tan et al. 2019). Personal views about whether individual and collective health are valued and prioritized may drive people “to act in ways that improve and protect their own health and the health of others” (Chandra et al. 2016; Tan et al. 2019). For people in positions of influence in local communities, businesses, and state-level organizations, attitudes regarding their organization’s perspective may result in decisions that advance health equity or reinforce inequities. Little is known about leaders’ attitudes regarding their organization’s perspective on what shapes health or how their attitudes translate into actions that improve population health.
There is a need to fill this gap in the evidence base—specifically how city and state leaders view, understand, and talk about the influences of health and well-being in communities, particularly social determinants of health and health equity. Most surveys have focused on the health attitudes of the general population, such as the National Opinion Survey on Health and Health Disparities (Booske, Robert, and Rohan 2011), the National Survey of Health Attitudes (Carman et al. 2016), the American Health Values Survey (Bye, Ghirardelli, and Fontes 2016), and COVID-19 and the Experiences of Populations at Greater Risk Survey (Carman et al. 2021). Other surveys have sampled subsets of leaders including American mayors (Einstein et al. 2020) and businesspeople (Heffernan et al. 2020). Still others have focused on the attitudes of people providing clinical care, such as health system executives (Lee and Korba 2017) or faculty at medical schools (Campbell et al. 2022). While these surveys have generally found that people are aware of social, economic, and racial health disparities, recognize the influence of social and physical factors on health, and support interventions that promote population health and health equity, they tend to overlook important predictors of behavior change such as self-efficacy and social norms. As a result, we developed the What Shapes Health and Well-Being survey to produce evidence on what leaders from all 50 U.S. states, 325 U.S. cities, and ten sectors think are important drivers of actions and policies that promote health and well-being in their respective cities and states across the United States.
The objectives of the survey were twofold: (1) to understand leaders’ attitudes with regard to their organization’s perspective on population health and (2) to identify the attitudes associated with leaders’ perspectives regarding their organization’s intention to engage in behaviors that advance population health.
We designed and conducted a mixed-mode survey from fall 2020 to spring 2022. A major challenge for the study was identifying the sample frame, which was meant to provide a list of all U.S. organization leaders at the city and state level covering ten sectors: 1) economic and community development, 2) education, 3) employment, 4) health care systems, 5) housing, 6) physical safety, 7) public health and social services, 8) recreation, physical activity, and open space, 9) transportation), and 10) cross-cutting.[1] An ideal sample frame is a complete list of everyone of interest one wants to study (Groves et al. 2009; Kish 1965; Lohr 2022). However, there was no single frame or source of data representing organization leaders across all the sectors of interest for our study. To draw a sample, we therefore needed to identify several sample frame sources from which to pull and construct a sample frame.
Frame construction
This study required examining attitudes of organization leaders at the state and city level. We first created a conceptual framework to inform the survey instrument and sample plan. The conceptual framework included constructs and topics for the survey instrument pertinent to promoting a culture of health and understanding attitudes related to health and well-being; and nine sectors plus a cross-cutting sector upon which we based our sample parameters. We then identified two groups of organization leaders, state-level and city-level, within sectors from which to sample (see Table 1). For the state-level sample, we selected a single-stage sample of leaders, stratified by state and sector within state. For the city-level sample, we selected a two-stage sample, first selecting cities with probability proportional to their population size and then selecting a sample of leaders stratified by sector.[2] Our target sample size was 2,300 state-level leaders from all 50 states and 15,100 city-level leaders from 325 cities and the District of Columbia.
We identified five sample frame sources to use to construct the two sample frames. Table 2 presents the sample frame sources, sectors and types of organizations each frame covered. These included Dun & Bradstreet (D&B), the Internal Revenue Service (IRS)-exempt organization business master file, the National Center for Education Statistics (NCES), government websites and public databases such as the New Markets Tax Credit public data release, and nongovernment websites and public databases such as those from public health associations.[3]
These five sample frame sources had various advantages and disadvantages. For example, D&B had good coverage for certain sectors that contained for-profit organizations, and it had variables that could help further classify organizations by certain characteristics. However, D&B did not have as good coverage for nonprofit organizations. The IRS business master file had a comprehensive list of tax-exempt organizations that were classified by their area of focus, but the file also contained many closed or otherwise defunct organizations. NCES’ Common Core of Data and Integrated Postsecondary Education Data System had excellent coverage of K–12 and postsecondary education institutions, but data release lagged by about two years. Government websites and public databases had up-to-date, high-quality data, but collecting and processing these data was a time-intensive activity that involved removing duplicate records or those that were out of geographic scope. We used nongovernment websites and public databases for gathering organizations in sectors not covered by the other sample frame sources, but these varied in terms of their quality and completeness.
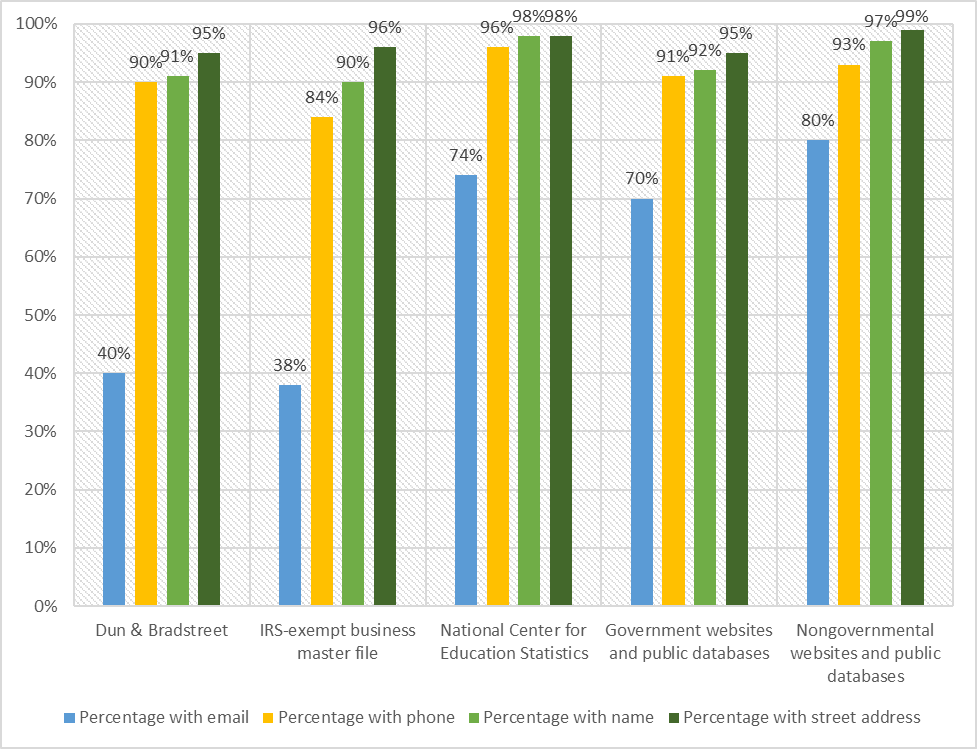
We compared the sample frame sources by the completeness of their contact information. The contact information obtained from each source, including through the manual online searches we conducted, varied by the sample frame source and by the type of contact information. Figure 1 presents the five sample frame sources and the percentage of each type of contact information we obtained (email address, telephone number, leader name, and business address). The sample frame source from which we obtained the most complete contact information was the NCES; we obtained phone numbers, leader names, and business addresses for 96 to 98 percent of the NCES sample frame, although NCES data are updated several times throughout the year, the data obtained lag by about two years, followed by the nongovernment websites and public databases, with 93 to 99 percent having contact information.[4]

The next two sample frame sources with the most complete information were government websites and public databases and D&B. For these sources, we obtained phone numbers, leader names, and business addresses for 90 to 95 percent of each sample frame. The IRS-exempt business master file provided the lowest percentage of contact information, although it was still relatively high, at 84 to 96 percent for phone numbers, leader names, and business addresses. D&B data are updated yearly, and IRS exempt organization master file are updated monthly to remove closed businesses.[5] [6] Interestingly, employment organizations sampled from the D&B and IRS frames had higher rates of ineligibility compared to other sectors. (We found that 10 percent of organizations sampled from the employment sector were closed or no longer in business.). The weakest contact information across all sources was email addresses, ranging from 38 percent (IRS) to 80 percent (nongovernmental websites and public databases).
Our process was to first construct a sample frame using all the sample frame sources we identified and pulling in organizations from these sources for all the sectors of interest. We then reviewed the frame and removed any duplicate records. We next drew a sample, stratified by location—either state or city—and then by sector. The sample consisted of 18,367 organizations; we released 13,193, and we held the remaining 5,174 in reserve as a back-up sample in case we needed to replace organizations that during fielding we determined were closed or no longer in operation.
Table 3 presents characteristics of the full eligible sample.[7] We used the information we had in our sample (first name, last name, and location) to develop an algorithm to predict the gender and race of our survey respondents. We predicted gender using first name. We predicted race using last name and geographic location. We reviewed the output from the algorithm and compared it to the gender and race provided by the survey respondents and made refinements to the algorithm. We then used the algorithm to predict the gender and race of the survey nonrespondents. Our last step was to manually review public websites to obtain any missing contact information, such as the leader’s name or the organization’s phone number, email address, and street address.
Data collection methods
We fielded the survey in two consecutive 22-week phases. We fielded Phase 1 from late December 2020 to May 2021 to 13,193 sample members. We fielded Phase 2 from late October 2021 to March 2022 to 5,174 sample members, including 4,239 sample members selected as a back-up sample before Phase 1 and 935 referral names provided by Phase 1 respondents.[8] Across the two phases, we completed 5,450 surveys and achieved a response rate of 32 percent.[9]
For both phases, we contacted sample members by emailing and mailing letters, and we encouraged them to complete the online survey. We followed up by mailing paper surveys and making telephone calls to conduct computer-assisted telephone surveys. The web survey was our first method of data collection, followed by the paper survey and finally the telephone survey. We continued to offer and encourage the web survey throughout the data collection period. In both phases, we sent an invitation email and several reminder emails to sample members for whom we had an email address. We personalized all emails and included a hyperlink to the survey. We mailed four letters (advance letter and three reminder letters) and three questionnaire packets. We personalized all letters, provided log-in information to access the web survey and included a toll-free number to call with questions or to complete the survey by telephone. Each questionnaire packet included a cover letter, paper questionnaire, and return postage-paid envelope. We included a colorful study brochure and a token incentive of a study-branded magnet in the first two mailings. We made numerous attempts to reach sample members by telephone to try to complete a survey. We staggered mailings, emails, and telephone calls over the 22-week field period.
Survey response
We achieved a 32 percent response rate overall but experienced a differential response across sectors. We had four sectors that surpassed the overall response rate, including housing, transportation, public health/social services, and recreation/physical activity/open space, while four other sectors lagged significantly behind, including employment, physical safety, cross-cutting, and economic/community development. Table 4 presents the response rates reached by sector. During data collection, we tailored our messaging in emails, letters, and phone calls to appeal to the different sectors and their location as a way of heightening salience and encouraging response. We also made additional calls to the lower performing sectors to try and boost response.
We encountered organizations that were closed or were duplicates of other organizations in our sample. We identified 6 percent of the total sample (1,186 cases) as ineligible, defined as either a permanently closed organization or one that was a duplicate of another sampled organization. Table 4 presents the variation in ineligibility rates by sector, which ranged from a low of 3.8 percent for the public health and social services sector to a high of 10 percent for the employment sector, with most sectors hovering about the average.
We compared the distributions of our survey respondents weighted by the inverse of the probabilities of selection and adjusted for nonresponse to the full eligible sample weighted by the inverse of the probabilities of selection. We compared these distributions by demographic characteristics and by region of organization location (Table 5). Survey respondents in the state sample were slightly more female and more White than the full eligible sample. Survey respondents in the city sample were slightly more male and slightly more White than the full eligible sample.
Discussion
We learned that these five sample frame sources all had good contact information overall, as evidenced by the 84 to 99 percent with a name, address, and phone number. Email addresses were the hardest item to obtain and varied greatly by source, ranging from a low of 38 and 40 percent from the IRS Master File and D&B, respectively, to a high of 80 percent from nongovernment websites and databases. During survey fielding, we identified 6 percent of cases as ineligible (businesses closed), but the rate varied across sectors. The sector with the highest ineligibility rate was the employment sector at 10 percent, and those organizations came primarily from the D&B, which had the second to lowest rates of contact information compared with the other sources. The lowest ineligibility rates were from education and public health sectors which came from NCES, government and nongovernment websites and databases, all of which had the highest rates of contact information.
We faced several challenges in pulling in so many varied sources to build our sample frame. It was a labor-intensive process to gather data from so many sources, many of which were manual efforts. Once the frame was constructed, we removed many duplicate cases, which also proved to be labor intensive. However, we missed some duplicates, such as those with names that were similar but different enough not to be easily identified using a programmed algorithm or a sort and visual scan (example, [State] Department of Health vs. Health Dept [State]).
If we were to do this exercise again, we would investigate whether there is another source for the employment sector organizations other than D&B, given that it had the second to lowest rates of contact information and a higher ineligibility rate for that sector compared to other sectors. At the time we created our frame, D&B was chosen since it was the best data source available. D&B also included organizations from other sectors that were covered by other frame sources. Thus, if we could find another source for targeting employment organizations, it could mean less resources spent on cleaning the frame to remove duplicates prior to sampling. There are other databases that report to have comprehensive lists of businesses such as Data Axle USA and NAICS Association, but these would need to be reviewed and compared against D&B for coverage, quality, and frequency of updating records.
Corresponding authors
Please contact Martha Kovac (mkovac@mathematica-mpr.com) or Nancy Clusen (nclusen@mathematica-mpr.com) at Mathematica for questions or additional information.
The cross-cutting sector included leaders in state and city government, community foundations, and faith, advocacy, and nonprofit organizations.
We chose cities across four geographic regions with a minimum population size of 50,000.
We did not include the IRS and NCES data sources under the general category of government databases for two reasons: (1) these sources represented a significant source of our sample frames and (2) these sources, particularly NCES, are designed to be comprehensive lists of the focal populations.
Tax Exempt Organization Search Bulk Data Downloads | Internal Revenue Service (irs.gov). The IRS requires a business to submit a form when they have closed and waits three years to receive notice before removing them from the tax exempt organization database.
We released 18,367 organizations for the survey and identified 1,186 as ineligible (closed business or no longer in operation), leaving 17,181 eligible organizations in the sample.
We asked Phase 1 respondents to nominate other leaders in their community whom they felt were influential and should be surveyed to ensure that we were not missing any community or other types of leaders through our sampling process.
We used American Association for Public Opinion Research’s (AAPOR) Response Rate 1 formula to calculate the response rate. Response Rates Calculator - AAPOR