Introduction
Survey researchers are well-aware of the long-standing problem of declining response rates over time (Connelly, Brown, and Decker 2003; Curtin, Presser, and Singer 2005; Keeter et al. 2017). The reasons for this decline are complex but include lifestyle changes, the emergence of new information technologies (e.g. cellular phones), and survey fatigue among the general public (D. Dillman 2015; D. A. Dillman, Hao, and Millar 2016). Although response rates are not necessarily an indicator of nonresponse bias (Davern 2013; Groves 2006), low response rates do cause researchers to invest additional resources into achieving an adequate sample size.
Though the primary causes of this decline are varied, one underexplored cause is the perception that researchers and the surveys they administer might be biased in some fashion. In the United States, there has been a startling growth in distrust in science (Gauchat 2011, 2012) and even claims that some scientists collude to deceive the public on climate change (Leiserowitz 2006; McCright and Dunlap 2010; Oreskes and Conway 2011). Other notable conspiracy theories regarding science include the notion that the U.S. government secretly engineered the AIDs virus to attack African-American communities (Bogart and Thorburn 2005; Goertzel 2010; Klonoff and Landrine 1999) and that vaccines cause autism (Jolley and Douglas 2014; Oliver and Wood 2014). This cultural backdrop suggests that the public may also have decreasing trust in survey research, perhaps perceiving surveys themselves as “biased.” Notably, some research does suggest that survey researchers are less trusted in the past (Kim et al. 2011).
We have conducted several studies around energy development and natural resource management at national, local, and regional scales (Malin et al. 2017; Mayer and Malin 2019; Mayer 2019). Without fail, a small subset of respondents in each of these surveys will volunteer that the survey was “biased,” perhaps in written comments or directly to interviewers. These perceptions of bias are paradoxical, wherein survey participants on opposing sides of an issues state that a survey is biased against their side. Anecdotally, we have discussed this issue with colleagues at professional gatherings and via private communications, and many of them report similar experiences. Our experiences and those of other seasoned survey researchers imply that some proportion of survey respondents believe that the survey administrators have some type of ulterior motive or have deliberately designed survey questions to produce biased responses. However, little is known about the extent or origins of these perceptions of bias beyond anecdotes.
In the well-documented “hostile media effect,” researchers have consistently shown that individuals highly invested in an issue see news coverage of the issue as biased against their perspective (Coe et al. 2008; Feldman 2011; Hansen and Kim 2011; Vallone, Ross, and Lepper 1985). Yet, individuals who hold a different perspective on an issue perceive identical media coverage as biased against their views. This dynamic was first demonstrated in the foundational study of Vallone et al. (1985) , who found that pro-Israeli and pro-Arab partisans viewed identical news coverage as biased against their side of that issue. This phenomenon of biased perceptions of bias has been documented over the last several decades, with consistent evidence that people perceive claims against their views as biased (Coe et al. 2008; Feldman 2011; Hansen and Kim 2011). We suggest that survey respondents on opposite ends of controversial issues may similarly perceive survey questions as “biased.” In the “Sample” section, we present preliminary data that, to the best of our knowledge, is the first analysis of perceptions of bias among survey respondents.
Sample
This research emerges from a larger project whose aim is to understand how individuals who are active in local government understand the fiscal and community impacts of distributed energy sources such as natural gas, wind and solar, and broader local economic development issues around natural resources. Our sample includes county and municipal government employees involved in planning, economic and community development, and fiscal issues broadly construed. Thus, we surveyed county commissioners, planners, city council members, and the staff of economic development offices. We focused on Colorado and Utah because of their similar topography and economies centered on natural resources, tourism and recreation, and the tech sector.
We identified local policy actors by accessing the website of county and municipal governments and recording email addresses. A small group of municipalities did not have websites—these were uniformly rural, with populations of a few hundred people or less. Other municipalities, again often extremely rural, did not provide contact information for officials. We attempted to contact these municipalities to procure contact information, with limited success. A further complication was that some counties and cities did not provide direct emails, but instead hosted online forms to contact employees. We provided a generic link to our online survey via these contact forms, and emailed policy actors directly when an email was available. Prior to survey administration, we pretested the instrument with a convenience sample of Colorado residents. After completing the pretesting, we adjusted some wording on the economic and energy development questions that are not used in the present analysis.
Our initial list included 2,224 policy actors. Eighteen emails were duplicated, and 14 were undeliverable. We located the duplicates in our database using Stata 15/IC (StataCorp, College Station, TX) to search for duplicate strings. The duplicates and undeliverables occurred because of incorrect information on city and county websites, such as erroneous characters provided in email addresses. We corrected these issues when possible. In total, we identified 2,125 local policy actors with valid email addresses and 43 policy actors with online contact forms for a total sample of 2,168 potential respondents. We used six waves of data collection (i.e. six recruitment emails) from August to October of 2017. The email invitation explained that the study was about energy and economic issues facing Colorado and Utah and explained that the funding source was the Midwest Sociological Society, an academic organization.
Some 300 completed the survey for a response rate of 14.27% per American Association for Public Opinion Research definition 1. Ideally, we would have preferred to achieve a higher response rate. First, in private emails, a few policy actors stated that they did not feel adequately educated on the topics covered in the survey and chose not to participate despite our assurances that their opinions would be appreciated. A second reason for the low response rate may relate to the timing of survey administration—many cities and counties had ongoing elections during our time of data collection, and a few policy actors reported that they were too busy with their reelection campaigns to participate.
Assessing perceptions of bias
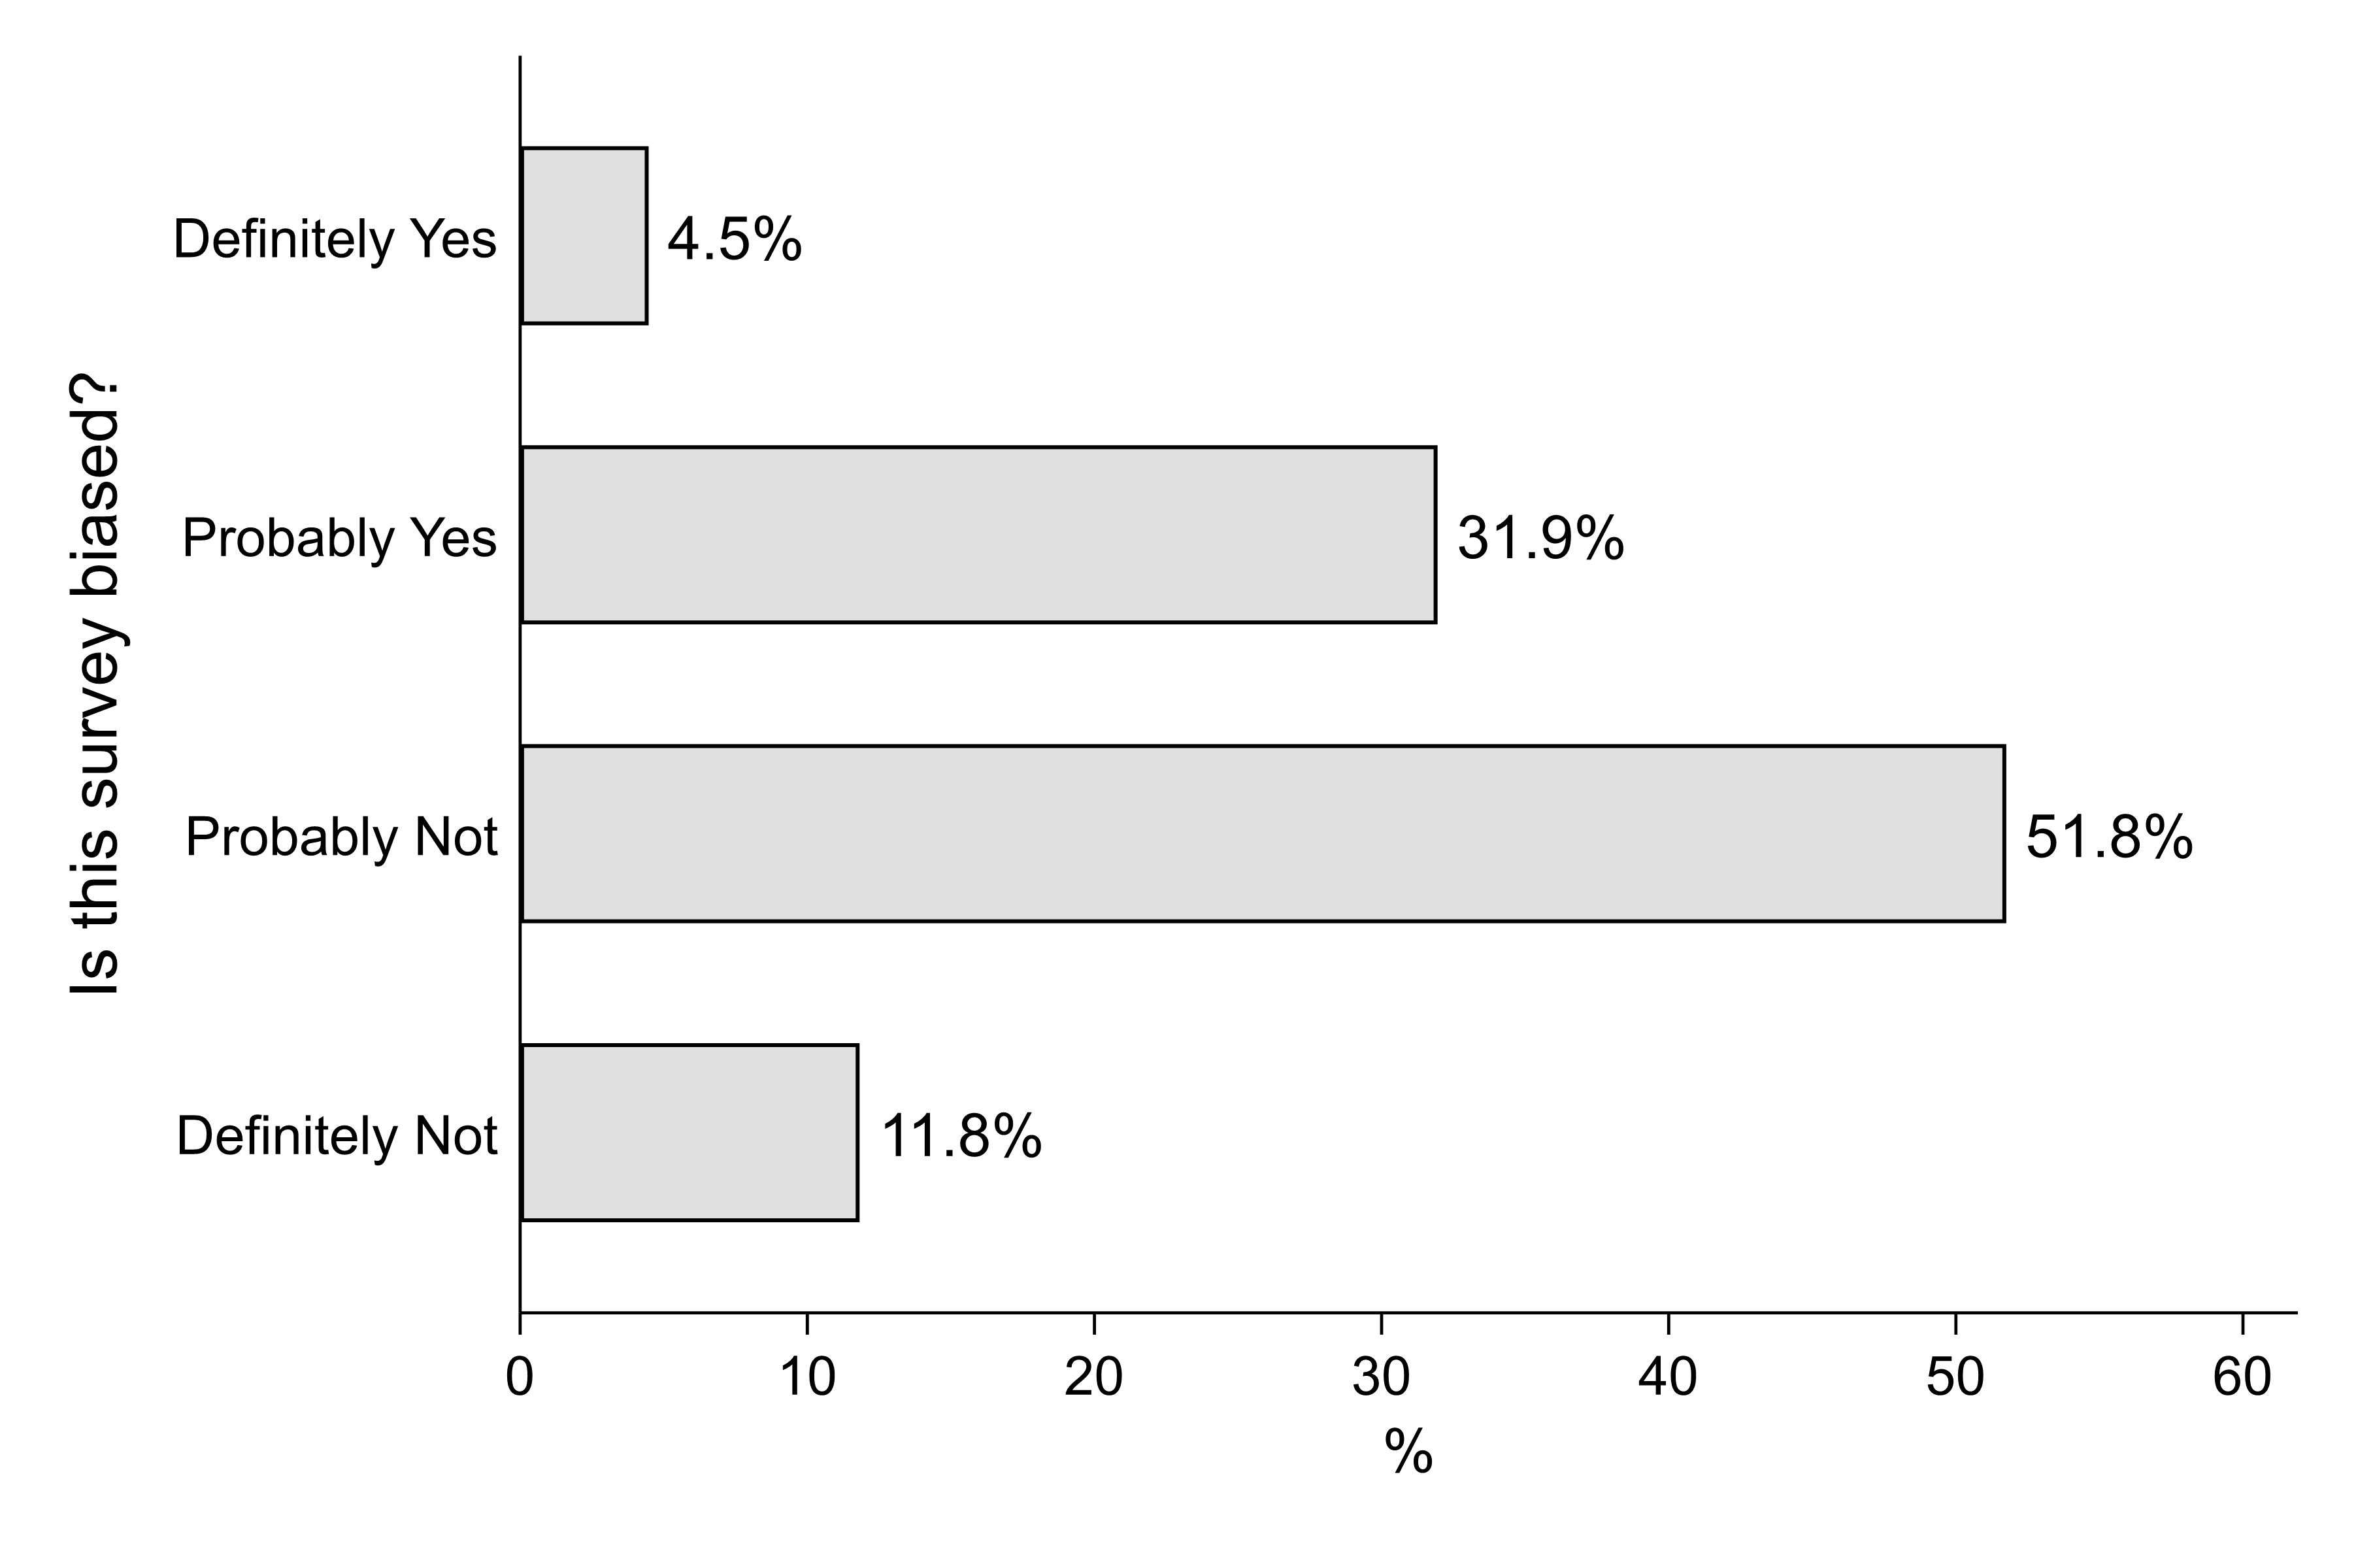
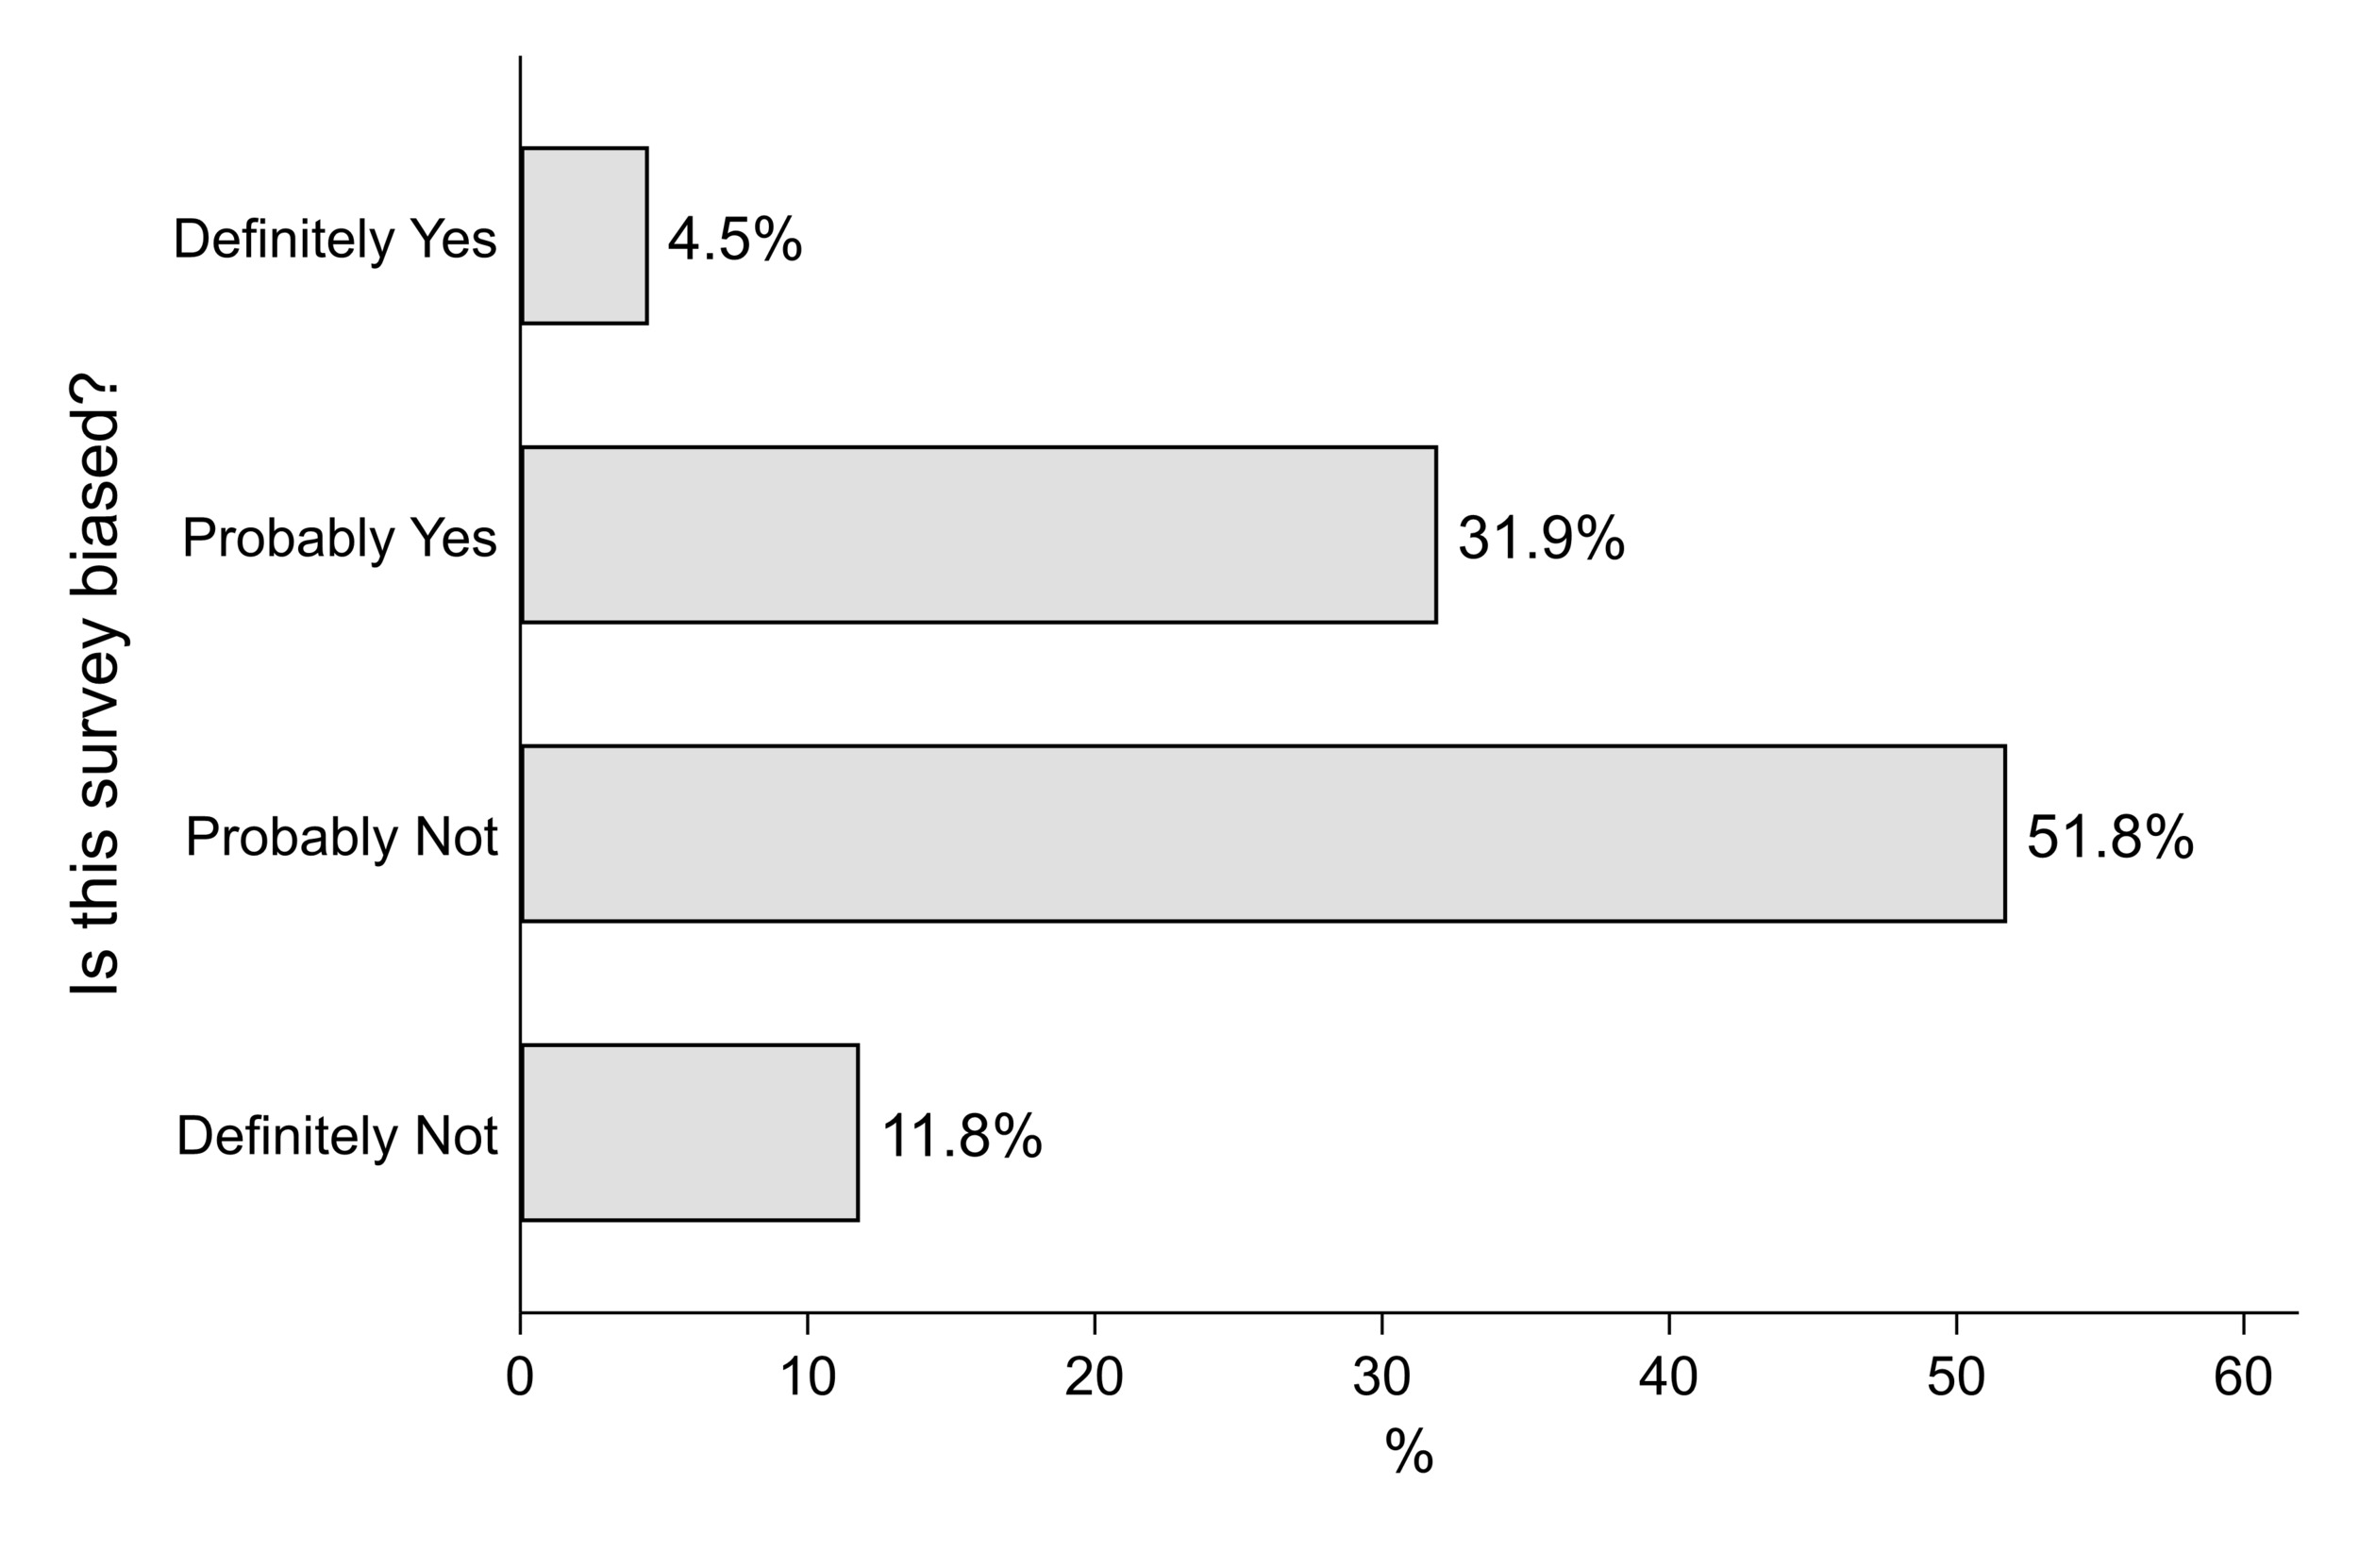
The final two questions in the survey asked respondents to assess the degree of bias in the survey. Respondents were asked: “Do you feel this survey is biased in any way?” and were offered the choices definitely yes, probably yes, probably no and definitely no. Respondents who answered definitely yes or probably yes were asked to clarify their answer in an open-ended question: “You mentioned that you felt that this survey was biased; please tell us more about the nature of this bias below.”
Figure 1 provides the distribution of the closed-ended biased question. A relatively small group of respondents (4.5%) indicated that the survey was “definitely” biased, though a much larger number (31.9%) answered that the survey as “probably” biased. Thus, a sizable minority of respondents felt that the survey was biased in some fashion.
Respondents who answered “definitely yes” or “probably yes” clarified what types of bias they perceived in a follow-up open-ended question. Sixty-eight of the 114 respondents who indicated that the survey was biased chose to provide a response. Their answers provide some preliminary indications of what might motivate perceptions of bias. Unsurprisingly, some respondents (17% of the 68 who answered the open-ended question) indicated that the survey was politically biased (e.g. one noted “universities are run by leftists”) while 5 (7.35%) commented that the survey seemed to favor fossil fuel interests—these types of responses are like the anecdotes described above wherein researchers find that respondents on opposite ends of an issue state that the survey is biased. Notably, 10 respondents (15%) gave extremely ambiguous responses such as “all surveys are biased” without providing additional context. One respondent indicated “definitely yes” but reversed their response in the open-ended question, stating that the survey was fair.
Respondents provided responses that were surprising and shed some light on what study participants might mean when they invoke the term “bias.” In total, 40% indicated that the survey was “biased” because they felt the response categories were not comprehensive enough, they could not choose multiple answers, or could not clarify their views further. This suggests that aspects of survey design—such as providing spaces were respondents can provide qualitative, narrative feedback, can potentially ameliorate the perception that survey researchers are biased. Some respondents appear to perceive bias when they are unable to fully express themselves.
Correlates of perception of bias
To understand how perceptions of bias might vary across sociodemographic and ideological groups, we correlated our quantitative indicator of bias with political party identification (0=Not Republican, 1=Republican); college education (0=less than college, 1= bachelor’s degree or greater); age (in years); male sex; and state of residence (Colorado vs. Utah). Note that our measure of bias is coded such that positive correlations indicate perceptions of bias. We present polychoric correlations in Table 1.
Overall, these correlations are quite small. Following research on distrust in science among conservatives, we suspected that Republicans might be more apt to report that the survey was biased (Gauchat 2012). Yet the near-zero correlation (rho=0.037) suggests that perceptions of bias have little relationship to party identification, and most sociodemographics have little correlation. One possible except is male sex, wherein males are more likely to report that the survey was biased. Although this correlation is still small (rho=0.172), it is certainly stronger than the others.
Conclusion and Future Directions
To the best of our knowledge, these preliminary results represent the first study of respondent perceptions of bias, although prior research has tracked more general perceptions of survey research (Kim et al. 2011). Our experiences and the experiences of several of our colleagues imply that some number of study participants in any study will perceive the survey instrument as biased against their perspectives or identities. In this section, we suggest directions for future research.
One obvious question is how perceptions of bias impact the quality of respondents’ answers. That is, do perceptions of bias cause respondents to invest less cognitive effort in survey questions, or perhaps even answer untruthfully? Although we suspect that this is not necessarily the case, some respondents who feel that researchers have an ulterior motive may provide low quality data. Another relates to failure to complete an interview—do some respondents terminate an interview because they feel the instrument is biased? Again, we suspect that this is likely rare, but it is certainly possible considering that a sizable minority of our respondents indicated that our survey was biased.
As we noted previously, our qualitative results were surprising. Some 40% of respondents could not seem to articulate a reason why they believed the survey was biased, suggesting that structured qualitative interviews are needed to unpack these perceptions. The “hostile media effect” literature indicates that perceptions of media bias arise with even neutral or positive coverage when that issue is uniquely salient. Informed by this literature, we suggest that future researchers work to untangle the relationship between perceptions of bias and issue salience. That is, are respondents who care deeply about a given issue more likely to report bias than those who are less engaged? Furthermore, could disclaimers about funding sources and the neutrality of the research team reduce perceptions of bias? There are no definitive answers to these questions, and we call upon future researchers to design studies capable of addressing them. We suggest that hybrid research designs with embedded interview incepts to leverage qualitative and quantitative data would be especially effective at unpacking respondent perceptions of bias.
Our qualitative results also implied that design features of the survey instrument may mitigate against perceptions of bias. Many respondents felt that the survey questions and response categories did not adequately capture the nuances of their perspectives—a well-known limitation of survey research. We suggest that one way to mitigate perceptions of bias could be to include additional space for respondents to clarify their opinions, perhaps by using additional text boxes and places on the instrument for respondents to provide qualitative feedback. Another potential solution is to encourage respondents to contact the research team to share their thoughts on the survey. During the cognitive pretesting phase, researchers could directly probe perceptions of bias. Research is sorely needed to test the efficacy of these strategies.
We urge researchers who study contentious issues with survey methods to more carefully attend to possibility that some portion of survey respondents likely perceive the survey instrument, or specific questions, as “biased” in some way or another. We have presented preliminary data on this topic, but much more research is needed to understand the extent and implications of this problem. We also encourage efforts to identify potential ameliorative mechanisms that can be implemented during survey data collection.
Author Information
Adam Mayer, Colorado State University, 206 Forestry Bldg, Fort Collins, CO 80523, adam.mayer@colostate.edu, 513-307-2000