Researchers have long been concerned with the issue of panel attrition—the loss of participants over time in longitudinal studies—recognizing its implications for the validity of multi-wave surveys. We turn our attention to this issue in an era of political polarization and declining participation rates. Specifically, we ask whether politically relevant variables influence participation in surveys of political attitudes and behavior, and whether these relationships have changed over time. If attrition is associated with variables tapping political engagement or extremity, making claims about political processes based on survey data becomes more tenuous. While prior research has focused on cross-sectional surveys, we extend this line of inquiry to panel data. To do so, we employ several American National Election Studies (ANES) datasets—including the pre- and post-election waves of the Cumulative File (1980–2016) and panel studies from 2000–2004 and 2016–2020. Our findings indicate that while the second wave of panel studies consists of more engaged respondents, these samples are not necessarily more polarized. Notably, the association between key political variables and attrition has weakened over time, suggesting that post-election samples, and the follow-up waves of multi-election panels, remain broadly representative in terms of polarization.
Background
Inferential threats arise if participants systematically differ from nonparticipants in panel studies—a longstanding concern (e.g., Deming 1953; Fitzgerald et al. 1998; Lazarsfeld 1948; Sobol 1959). And while scholars have long worked to develop methods to mitigate this problem and have developed techniques to increase participation—including offering incentives and maintaining communication (e.g., Singer 2002) as well as employing imputation techniques for missing data (e.g., Honaker and King 2010), examining these issues remains crucial in order to ensure the reliability and validity of longitudinal research, especially in an era of declining response rates.
Existing evidence indicates that attrition is associated with both relevant demographic variables, and directly of interest to our line of inquiry, political participation. Olson and Witt (2011) demonstrate that while overall attrition rates in the ANES remained stable from 1964 to 2004, the correlates of dropping out changed. Over time, relative retention rates declined among younger, female, less educated, and non-white respondents, while increasing among older, male, more educated, white, and Republican respondents. Crucially, nonvoters consistently exhibited higher attrition rates, suggesting a bias toward politically engaged individuals in subsequent waves of election studies. Moreover, the relationship between voting and survey participation remained stable during the period examined. This same theme was observed in Sciarini and Goldberg (2016), as post-election surveys tend to overrepresent voters. This evidence aligns with broader evidence that “nonignorable” non-response is often associated with topic interest (Groves et al. 2004).
In the context of election surveys, this pattern extends beyond voting to political engagement more generally. Beyond participation, campaign interest is sensitive to panel effects (Bartels 1999). Likewise, political engagement predicts participation in opt-in panels (Hopkins and Gorton 2024; Malhotra and Krosnick 2007). Importantly, we argue that a more politically engaged and interested sample will not necessarily be one that is more polarized. While polarization is correlated with political information and engagement, like most correlations observed in this research domain, the size is modest (e.g., Druckman and Levy 2022; Phillips 2024), though this depends on context (Guedes-Neto 2023). In other words, not all respondents who are interested in politics have more extreme views. With that said, it could very well be the case that extremity is itself a predictor of survey participation, especially as politics has become more polarized. That is, if polarization makes conflict a more salient aspect of politics, less partisan individuals and those with more moderate views may decide to not participate (e.g., Groenendyk et al. 2025).
Indeed, recent research suggests that polarization in surveys may be overstated (Cavari and Freedman 2018, 2023). If respondents who hold more partisan views are more likely to participate in surveys, observed levels of polarization will be inflated. This conclusion has not gone unchallenged: Mellon and Prosser (2021, 2025) argue that the effect of non-response bias on estimates of polarization is less pronounced as both polarization and response rates are correlated with time. We extend this line of inquiry to panel data. While our analyses cannot definitively resolve the debate about who initially opts to be surveyed, we aim to provide insight into how politically relevant attitudes shape survey participation. Specifically, we ask: Do politically relevant variables—interest, partisan strength, affective polarization, and vote intention—predict panel attrition? And has this relationship changed over time as elite polarization has increased? To explore these questions, we analyze multiple panel datasets that span nearly 40 years.
Data
To examine the relationship between politically relevant variables and panel attrition, we make use of three datasets from the ANES. The ANES is a long-running nationally representative survey of U.S. voters’ political attitudes and behavior funded by the NSF (https://electionstudies.org). We begin by examining the pre- and post-waves of the Time Series cross-sections using the Cumulative File (American National Election Studies [ANES] 2022).[1] Due to question availability, we examine data from 1980–2016.[2] The pre-election wave is generally conducted in late September through early November, while the post-election wave is conducted in November–December. The ANES has maintained a high retention rate across the pre- and post-election waves for the Time Series, though there is year-to-year variation.[3] While the retention rate is high, it is possible that politically relevant variables are associated with attrition or that the correlates of completing the second wave have changed over time. This dataset’s advantage is its long history, providing a wide range of elite polarization. Prior to 2012, the ANES primarily conducted the pre-election survey using face-to-face interviewers, though from 1992–2000, some respondents were interviewed over the phone. In 2012 and 2016, a portion of respondents self-administered the survey online. Consequently, we adjust for the impact of survey mode as it may predict survey participation (e.g., Frankel and Hillygus 2014).
We additionally analyze two panel datasets covering two elections each: the 2000–2004 Merged File (ANES 2005) and the 2016–2020 Panel Merged File (ANES 2024). In the 2000 panel, respondents were initially interviewed face-to-face (55%) or by phone, with all recontacts in 2004 conducted by phone. The 2016 panel used a dual-mode design (71% face-to-face, 29% online), while all 2020 recontacts were online. We again adjust for the mode of administration in the initial wave. These datasets, 16 years apart, allow us to examine how increasing polarization influences participation. The key advantage here is the extended time between waves. Longer gaps between survey waves lead to greater attrition, producing more variation in whether respondents continue participating. We argue, therefore, that the short- and long-term panel data complement one another in this regard, as short-term panels minimize unmeasured confounding (fewer intervening life changes occur over weeks vs. years), while long-term panel data allow for more variability. Our dependent variable in each analysis is whether respondents completed the subsequent wave (1 = completed, 0 = not completed).
Our primary interest is in politically relevant variables. Here we outline our key measures.[4]
Interest: Self-reported interest in the campaign, measured by a three-point item, ranging from not at all interested (1) to very interested (3).
Partisan strength: A four-point scale, ranging from pure independent (1) to strong partisan (4).
Issue extremity: Based on five seven-point issue attitudes included in each year, folded around their midpoints. The issues include defense spending, spending on services, aid to minorities, health insurance, and guaranteed jobs. An index is constructed ranging from zero to three, with higher values indicating greater extremity. For each dataset we find that the items form at least a somewhat reliable scale and factor analyses indicate one-dimensional solutions.
Affective polarization: We include affective polarization which we measure as the absolute value of the difference in ratings of the two major parties using feeling thermometers.[5] Therefore, the resulting variable ranges from 0 to 100.
Vote choice: We include measures of the respondent’s vote intention, using dummy variables for intending to vote for the losing candidate or to abstain. Supporters of the winning candidate tend to be more satisfied and happier (e.g., Toshkov and Mazepus 2023) and thus more likely to participate in the post-election wave, whereas supporters of the losing candidate and abstainers are expected to be less engaged and therefore less likely to complete the second wave. An intention to vote for the winning candidate serves as the reference category.
We also include a set of control variables. We include marital status, coded one for married and zero for all others. We include region based on Census Bureau Coding (with the Northeast as the omitted category). We include race, with dummy variables for Black, Latino, and other (with white as the omitted category), age measured in years, and sex with females coded as one. As noted, we adjust for the mode of interview administration in the first wave with dummy variables for phone and internet (with face-to-face as the omitted category) when utilizing the Cumulative File. When pooling the 2000–2004 and 2016–2020 panel data, we code face-to-face respondents as one and all others as zero.
Pre- and Post-Election Results
Let us first turn to the Cumulative File. We begin by examining how our variables of interest vary by whether respondents completed the post-election survey. Table 1 reports means (or proportions) for each group, along with the difference between those who did and did not complete the post-election wave. While several of these differences reach conventional levels of statistical significance, most are substantively small. The one notable exception is abstention and reporting an intention to vote for the winning candidate: respondents who completed the post-election wave were less likely to report an intention to abstain in the pre-election survey. We now turn to examining these relationships while controlling for other factors in the multivariate models below.
To do so, we begin by presenting results estimated from a logistic multilevel model with respondents nested in years. Results are presented in Table 2, where entries represent coefficients with standard errors in parentheses. We find that political interest and reporting an intention to vote are positively correlated with completing the post-election wave. However, issue extremity is negatively associated with completing the post-election wave, and affective polarization is unrelated to such behavior. Notably, variance inflation factor tests revealed no signs of problematic multicollinearity, and re-running the models without the engagement variables yielded coefficients for the remaining predictors that were substantively unchanged. On balance, these results do not suggest that those who complete the second wave are more extreme than those who do not, though those who do are more engaged with politics.
It may nevertheless be the case that there has been a change in the correlates of attrition. To shed light on this question, we interact each of the variables of interest with a year counter. This approach tests for whether there is a linear change over time. We opt for this straightforward approach as we are most interested in whether an increase in political polarization—which has increased consistently since 1980 (e.g., McCarty et al. 2016)—has led to the post-election sample being more politically engaged over time. In the supplementary material, we present results of an alternative specification that allows for greater flexibility, by using year-specific dummy variables, which returns substantively identical results.
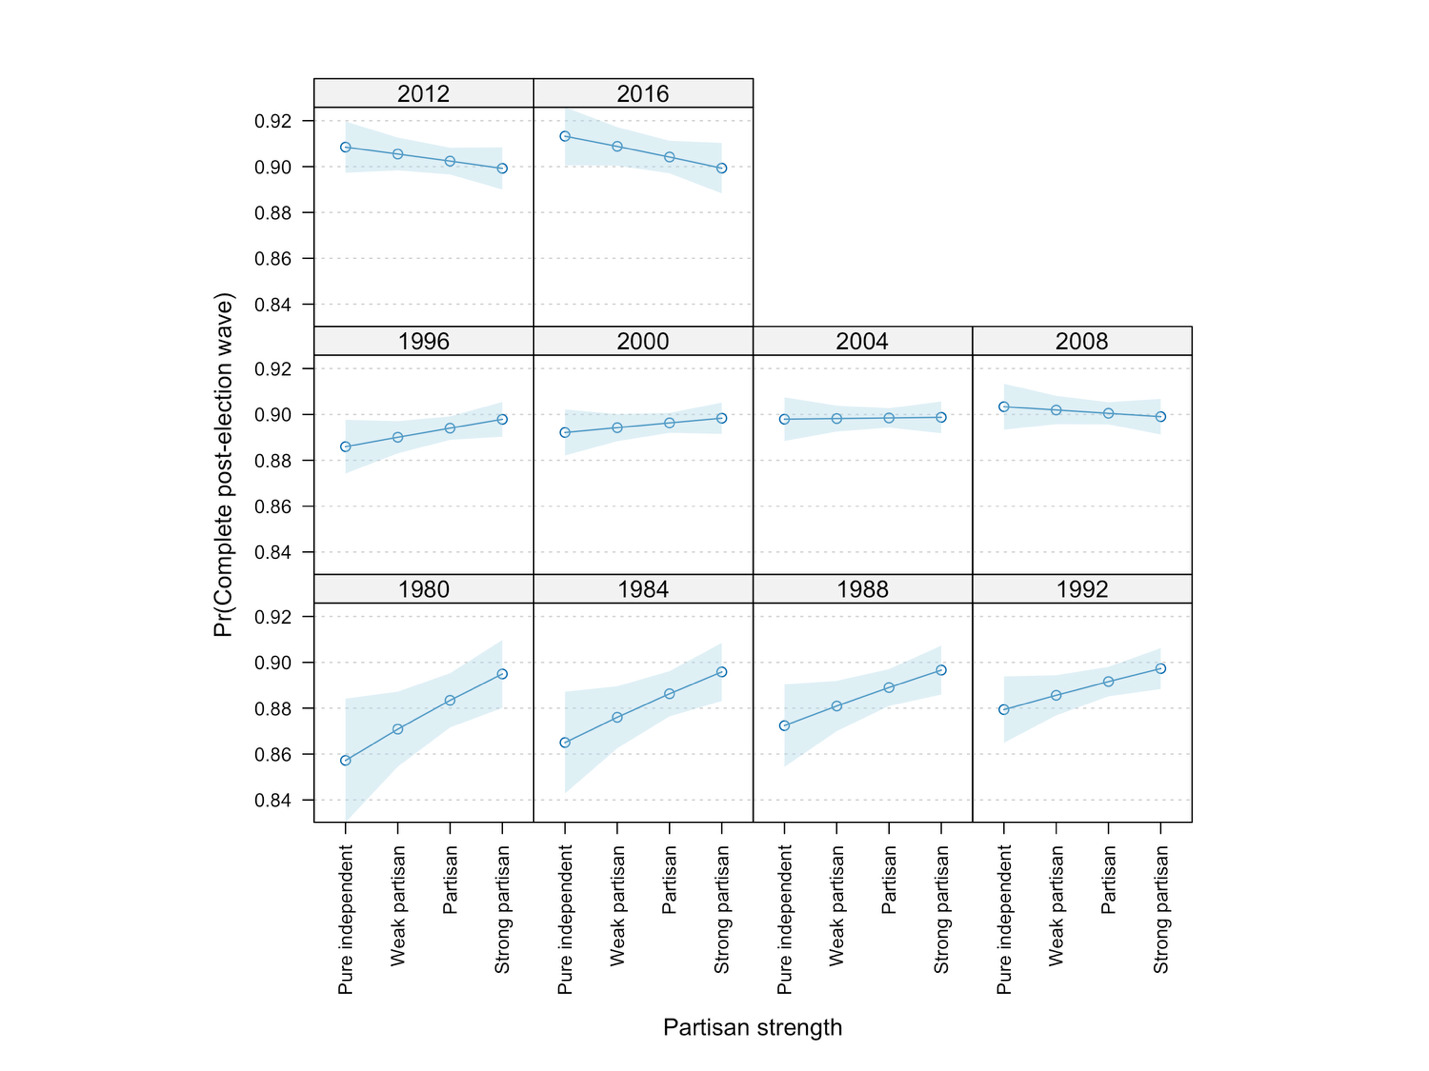
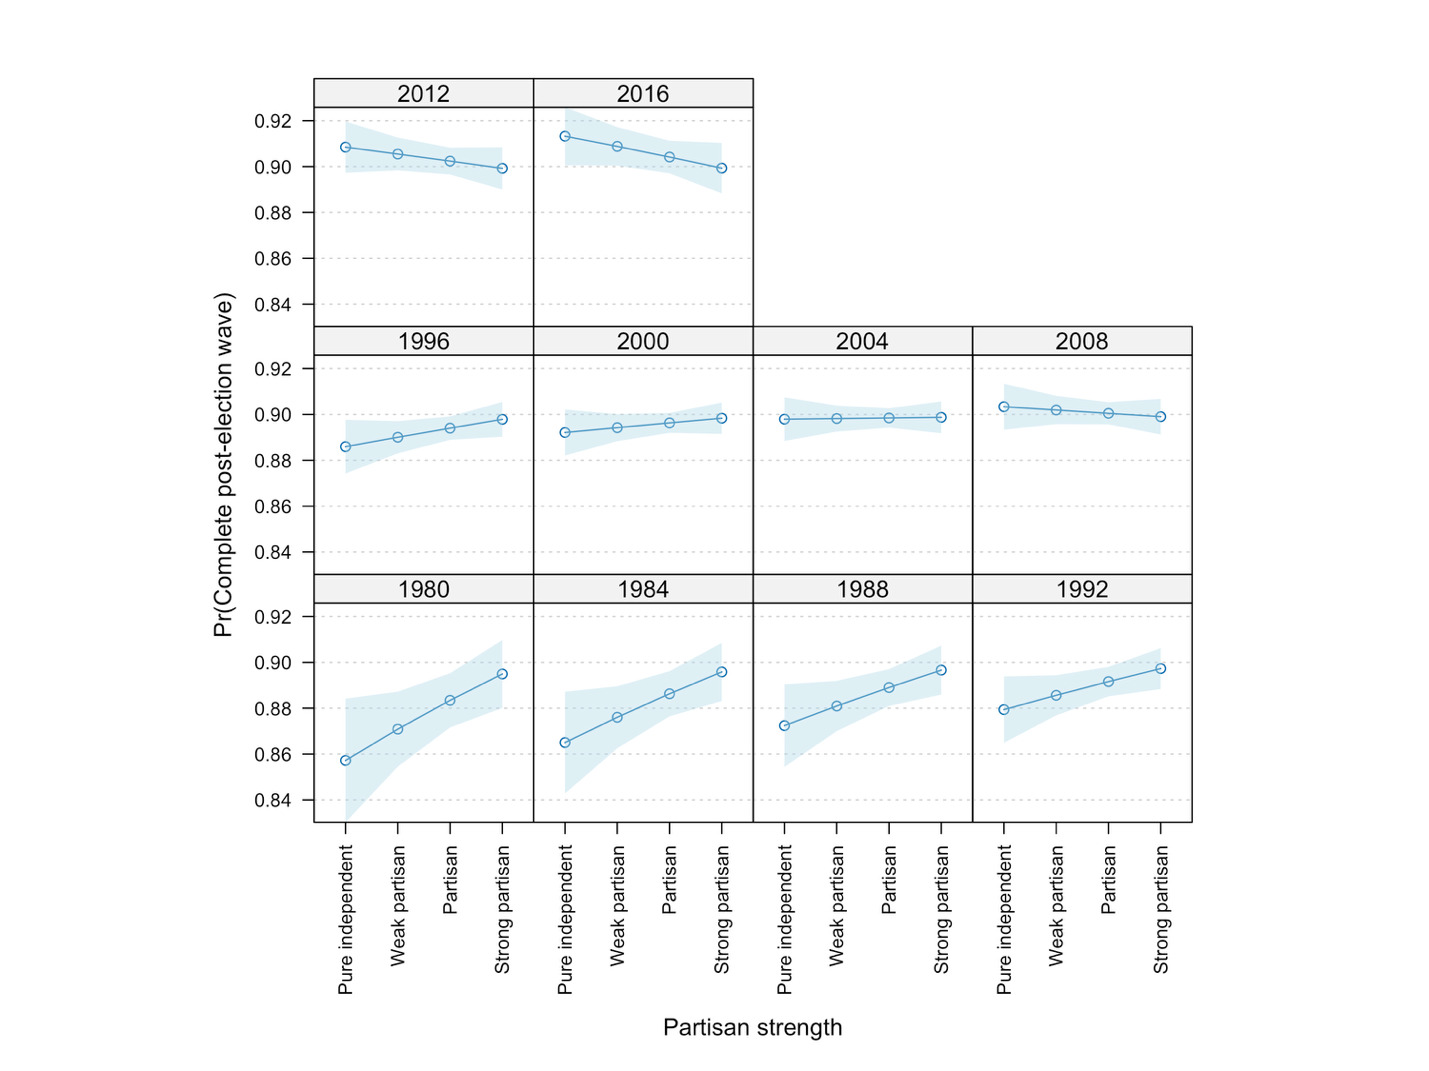
Table 3 presents the logistic model results. We find no evidence that the relationship has strengthened over time. Instead, the relationship between attrition and each of the variables has attenuated.[6] We demonstrate this in detail for partisan strength in Figure 1, which presents predicted probabilities of being interviewed post-election conditioned on partisan strength for each year. The relationship is significant at the beginning of the series—with stronger partisans being more likely to complete the post-election wave—and diminishes over time. In summary, analyses of the ANES Cumulative File indicate that survey samples retain politically engaged individuals without overrepresenting those with more extreme and partisan views. Further, polarization over time has not increased the correlation between politically relevant variables and attrition. These results suggest that the post-election samples do not exhibit skewed polarization relative to the initial wave.
2000–2004 and 2016–2020 Panel Data
We now turn to the panel data spanning two election periods, focusing on whether the correlates of panel attrition have changed from 2000–2004 to 2016–2020. We estimate the model separately for each period using logistic regression, with results presented in Table 4. Across both periods, partisan strength, issue extremity, and affective polarization do not significantly predict participation in the second wave, while abstaining and voting for the losing candidate are significant only in the 2016–2020 data. To formally test whether coefficients differ across periods, we pool the two datasets and interact each variable of interest with a dummy representing the year. Only one interaction term is statistically significant, issue extremity. Its relationship with attrition has weakened over time, being negatively associated in 2000–2004 with participating in the second wave but unrelated in 2016–2020. These results are reported in the supplementary material.
The results of these analyses align closely with the results from the Cumulative File. We find no evidence that politically relevant variables are becoming more associated with attrition. While panel attrition is always a concern, it does not appear that those who complete the second wave are consistently more extreme than those who drop out. That this pattern emerges across both shorter and longer timeframes reinforces our confidence in the representativeness of the samples, at least regarding this dimension.
Conclusion
The purpose of this study is to examine the relationship between politically relevant variables and attrition in panel studies. As response rates have declined, it is reasonable to wonder if samples used to measure political attitudes and behavior are representative. Our analyses demonstrate that political polarization does not appear to significantly affect the reinterview rates of post-election surveys. Moreover, the relationship between panel retention rates and key political variables, such as partisan strength and issue extremity, has weakened over time. So, while politically engaged individuals are more inclined to complete surveys, the samples are not more polarized. Further, these findings extend to longer-term panel data that span two presidential elections, reinforcing confidence in the representativeness of the samples. In other words, attrition does not systematically bias results toward more extreme political views.
As with any study, ours has important limitations that are worth considering. To begin, our analysis is, of course, limited to observable variables included in the first wave of the survey. Unmeasured confounders that influence both polarization and survey participation could still affect inferences about the broader population. Further, there are important ways that the second wave differs from the first, as we find that the second wave consists of more engaged individuals. At the very least, we need to be cognizant of the fact that samples are overrepresenting engaged individuals, a pattern that consistently emerges in studies on survey participation. And it is very plausible that such variables may become increasingly linked to variables of interest moving forward. Most crucially, our study cannot speak to who participates in the initial wave. While there is reason to expect that the behavior of initial wave participation and second wave completion is related, this remains an open question. Indeed, we note that one possible explanation for the declining predictive value of politically relevant variables and attrition is because these variables share a larger relationship with participation in the initial wave.
Corresponding author contact information
Judd Thorton, Georgia State University. jrthornton@gsu.edu sdejesuslina1@gsu.edu
Our analysis is unweighted as it focuses on predictors of attrition in the sample rather than population estimates.
We exclude 2020 as it was conducted almost entirely online, leading to issues of comparability to earlier years. We estimate a model that includes 2020 video respondents in the supplemental material, which returns results similar to those presented here.
We display the percentage of respondents who complete both waves by year in the supplementary material.
We would ideally include political information. Unfortunately, most items suitable for measuring it are assessed in the post-election wave (e.g., knowledge of which party controls the House). One item that is included in the pre-election wave, the interviewer’s assessment of the respondent’s political knowledge, is unavailable for internet self-administered respondents. We estimate a model excluding such respondents and including this item and present results of it in the supplementary material. We find that knowledge positively predicts participating in the post-election wave. All other substantive conclusions remain identical to those presented here.
We opt for this measurement approach to retain pure independents.
Because several political variables exhibit negative baseline associations with post-election completion, positive interactions with year indicate attenuation of these effects over time; conversely, negative interactions reflect attenuation of positive baseline associations.