Introduction
Face-to-face survey research in politically or socially difficult settings often breaks down at the last stage of sampling. Higher-level population counts from the census may still exist, but most of the time, the research team cannot obtain a credible household list, cannot trust the list it obtains, or cannot use it without creating extra political risk. When that happens, a large share of survey error can enter before the first interview begins, because field teams are effectively told to “find” households without a stable rule for doing so. This breakdown occurs because traditional area probability designs rely on high-quality, up-to-date census data and household registers that are often missing or obsolete in resource-limited or conflict-affected countries (Eckman et al. 2018). During the fourth wave of the Asian Barometer Survey (ABS) in China and Myanmar in 2018 and 2019[1], that was the problem we encountered.
Myanmar and China posed different operational constraints. In Myanmar, the ABS project had workable population information at the township level from the 2014 census data, but not a defensible final-stage household frame across the whole country. Parts of the country were also inaccessible because of conflict. In China, the issue was less the absence of data at higher levels than the limits of name-list sampling in a setting shaped by migration, data protection concerns, and official sensitivity around survey activity (Landry and Shen 2005). These challenges are particularly acute when attempting to sample ‘floating’ populations or migrants, who are frequently undercounted or missing from official registers entirely (Chen et al. 2018). In both countries, a standard multistage probability proportional to size (PPS) design still made sense at the top of the design. The trouble began when the survey needed a defensible rule for identifying households and selecting respondents at the last stage.
In this article, we share our experience addressing that problem by replacing the weakest stage of the design with a geospatial framework. Our approach used gridded population data, digital boundaries, GPS navigation, and scripted sample preparation to turn a difficult final stage into a documented probability process. Our approach was broadly similar to other research using gridded population data and spatial sampling (see Qader et al. 2020; Thomson et al. 2020) with open-source, publicly accessible data to achieve probability-based sampling. The following sections of this article describe our design, report what happened in the field, and use benchmark comparisons to assess whether the resulting samples were sufficiently close to population distributions to justify the method for similar studies, perhaps not only in China and Myanmar, but also in other countries where the last stage of PPS is missing.
Sampling Design
The design kept the parts of conventional PPS sampling that were still usable. In both countries, higher-level administrative stages remained in place, while the weakest final stage was replaced with a GIS/GPS-assisted area design. In Myanmar, township and ward-village selection still relied on available population information (Asian Barometer Survey 2020). In China, higher-level administrative selection likewise remained intact even though village or neighbourhood name lists were not suitable as a final-stage frame. Table 1 summarises the common design logic and the main operational differences between the two country cases.
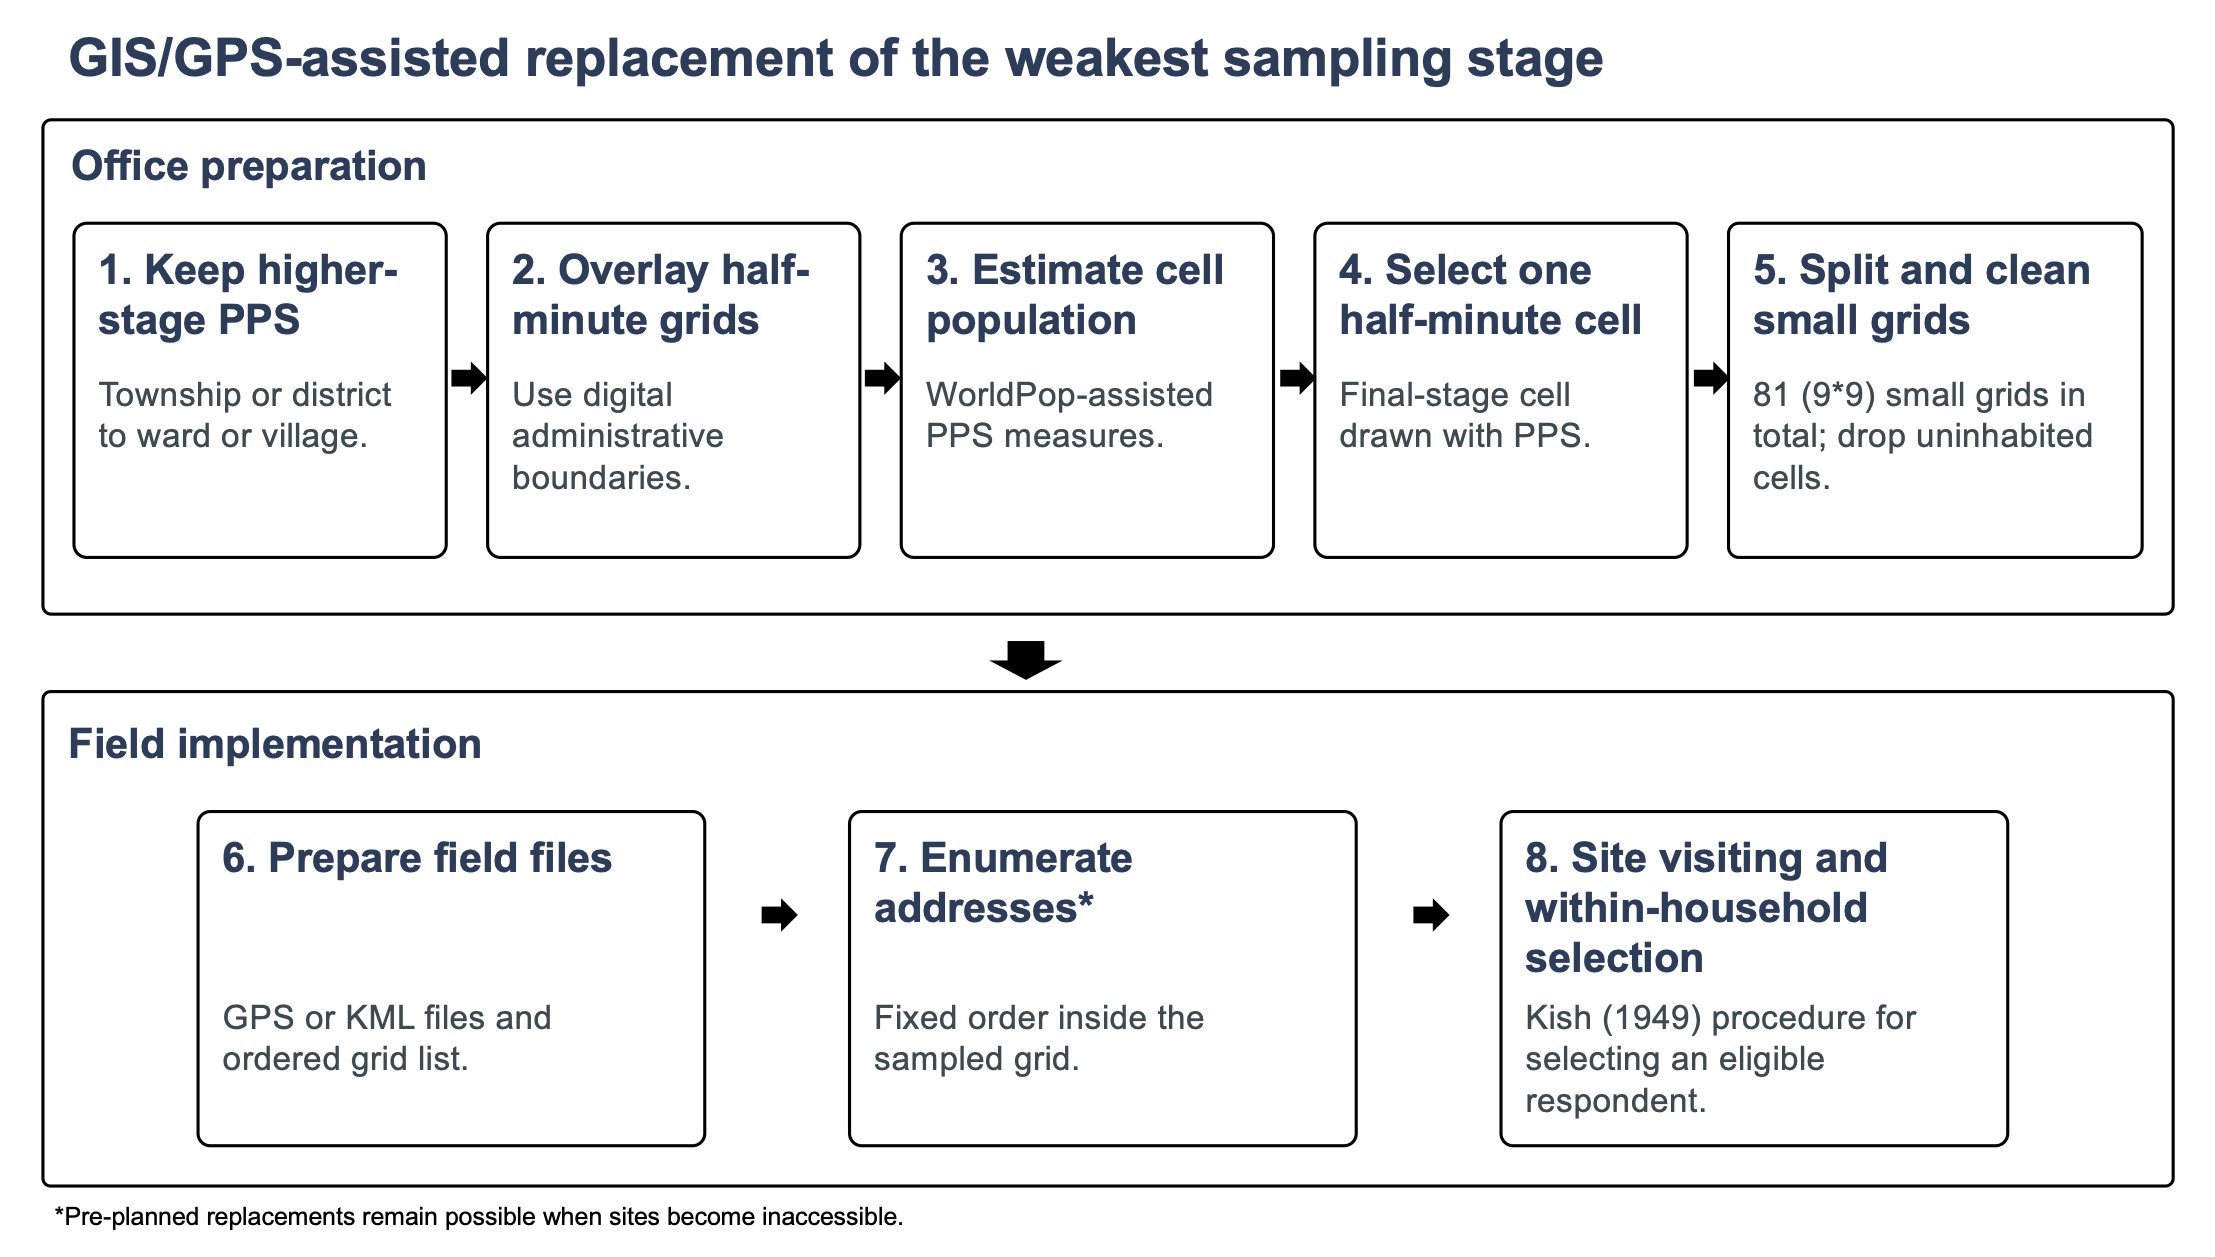
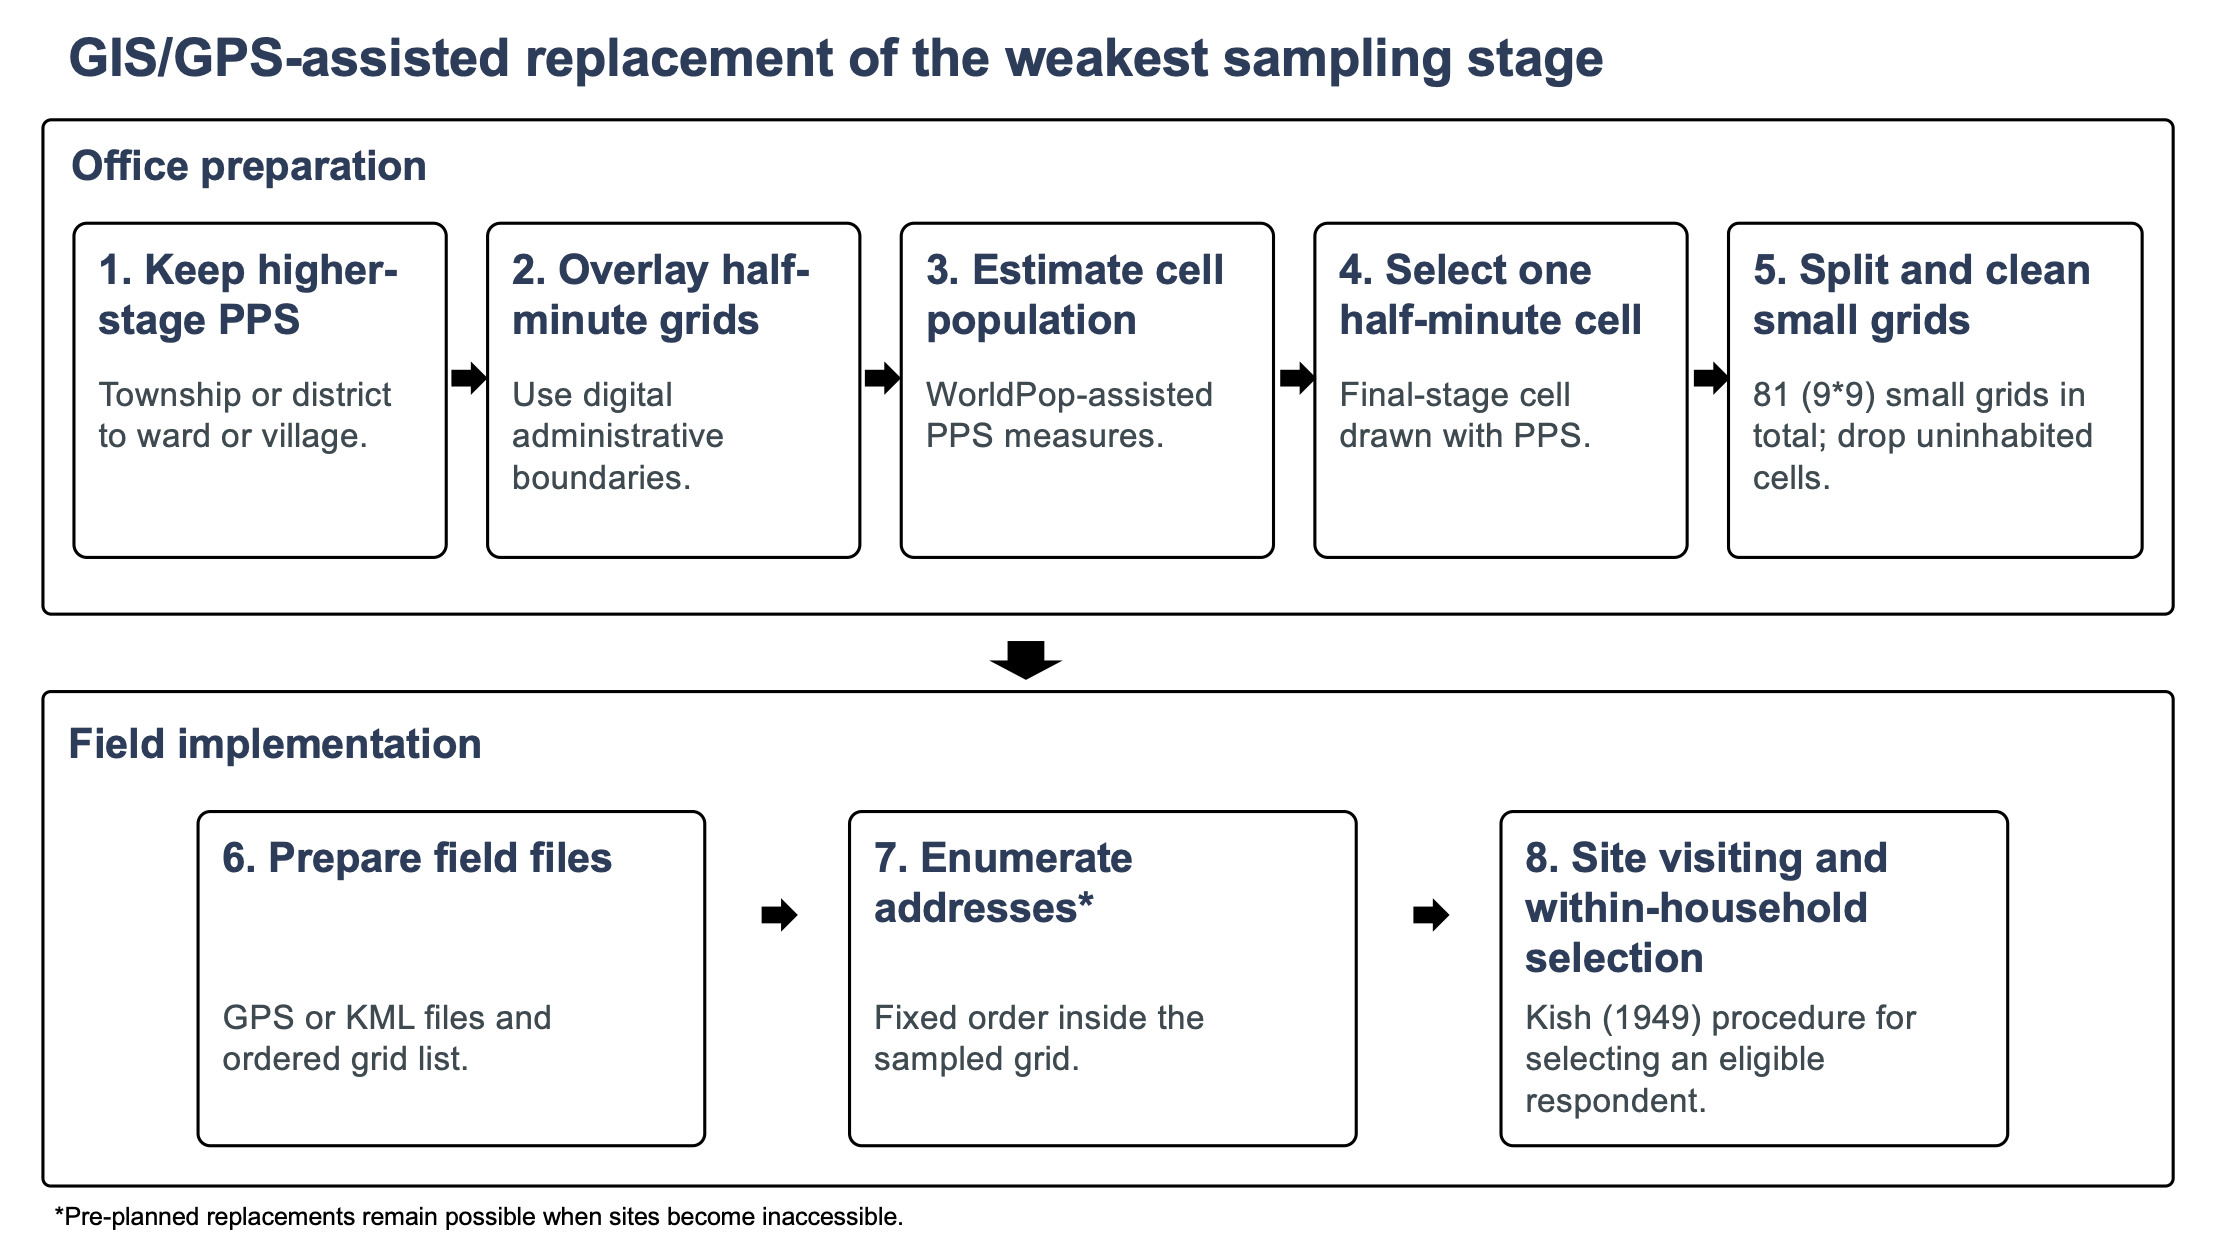
In both countries, the key innovation came after the selection of the ward, village, or neighbourhood. Each sampled local unit was overlaid with a half-minute grid[2], the population in each cell was estimated from gridded population data, one grid cell was selected with PPS, and that cell was then divided into 81 smaller grids for field release. Clearly uninhabited cells were removed before fieldwork. The result was a small, geographically bounded sampling unit with an explicit probability of selection.
In Myanmar, the small grids were roughly 90 by 90 metres. In China, the small-grid dimensions varied slightly by location because of the geographical size of the country, but were about 80 by 100 metres in Beijing, for example. In both countries, the sampled unit was a small, walkable, geographically bounded cell with an explicit probability of selection. However, the key question ahead of us is: where should we find the gridded population estimates and the boundary data for the selected ward, village, or neighbourhood?
Let us start with the population estimation. In our project, WorldPop was used for gridded population estimates because it offered a high-resolution, openly available population surface suitable for PPS work at the small-area level (Tatem 2017). Most importantly, the academic project offers us a free-to-access and high-quality data resource. Secondly, the digital boundaries of lower-level administrative units were derived from country-specific boundary files and open mapping sources, OpenStreetMap (OSM), and processed in QGIS and related tools. These open source tools let us construct the frame directly from spatial data rather than from household lists, and the advantage was practical as much as statistical. By doing so, ABS could prepare field materials without waiting for local authorities to release household rosters, and it could reproduce the selection process if a sampled site later became inaccessible[3],[4]. We show the common design logic in the two country cases and the main operational differences in how the PPS and GIS/GPS stages were implemented in Table 1.
Within each sampled small grid, interviewers listed addresses in a fixed order and then worked through households until the required number of completed interviews had been obtained. This was not a random-walk procedure. The sampled grid was randomly selected and defined in advance, along with the visiting order of household listing, and within-household respondent selection was defined in advance using a Kish procedure (Kish 1949). The design, therefore, preserved a known probability structure at the stage where household identification could become discretionary.
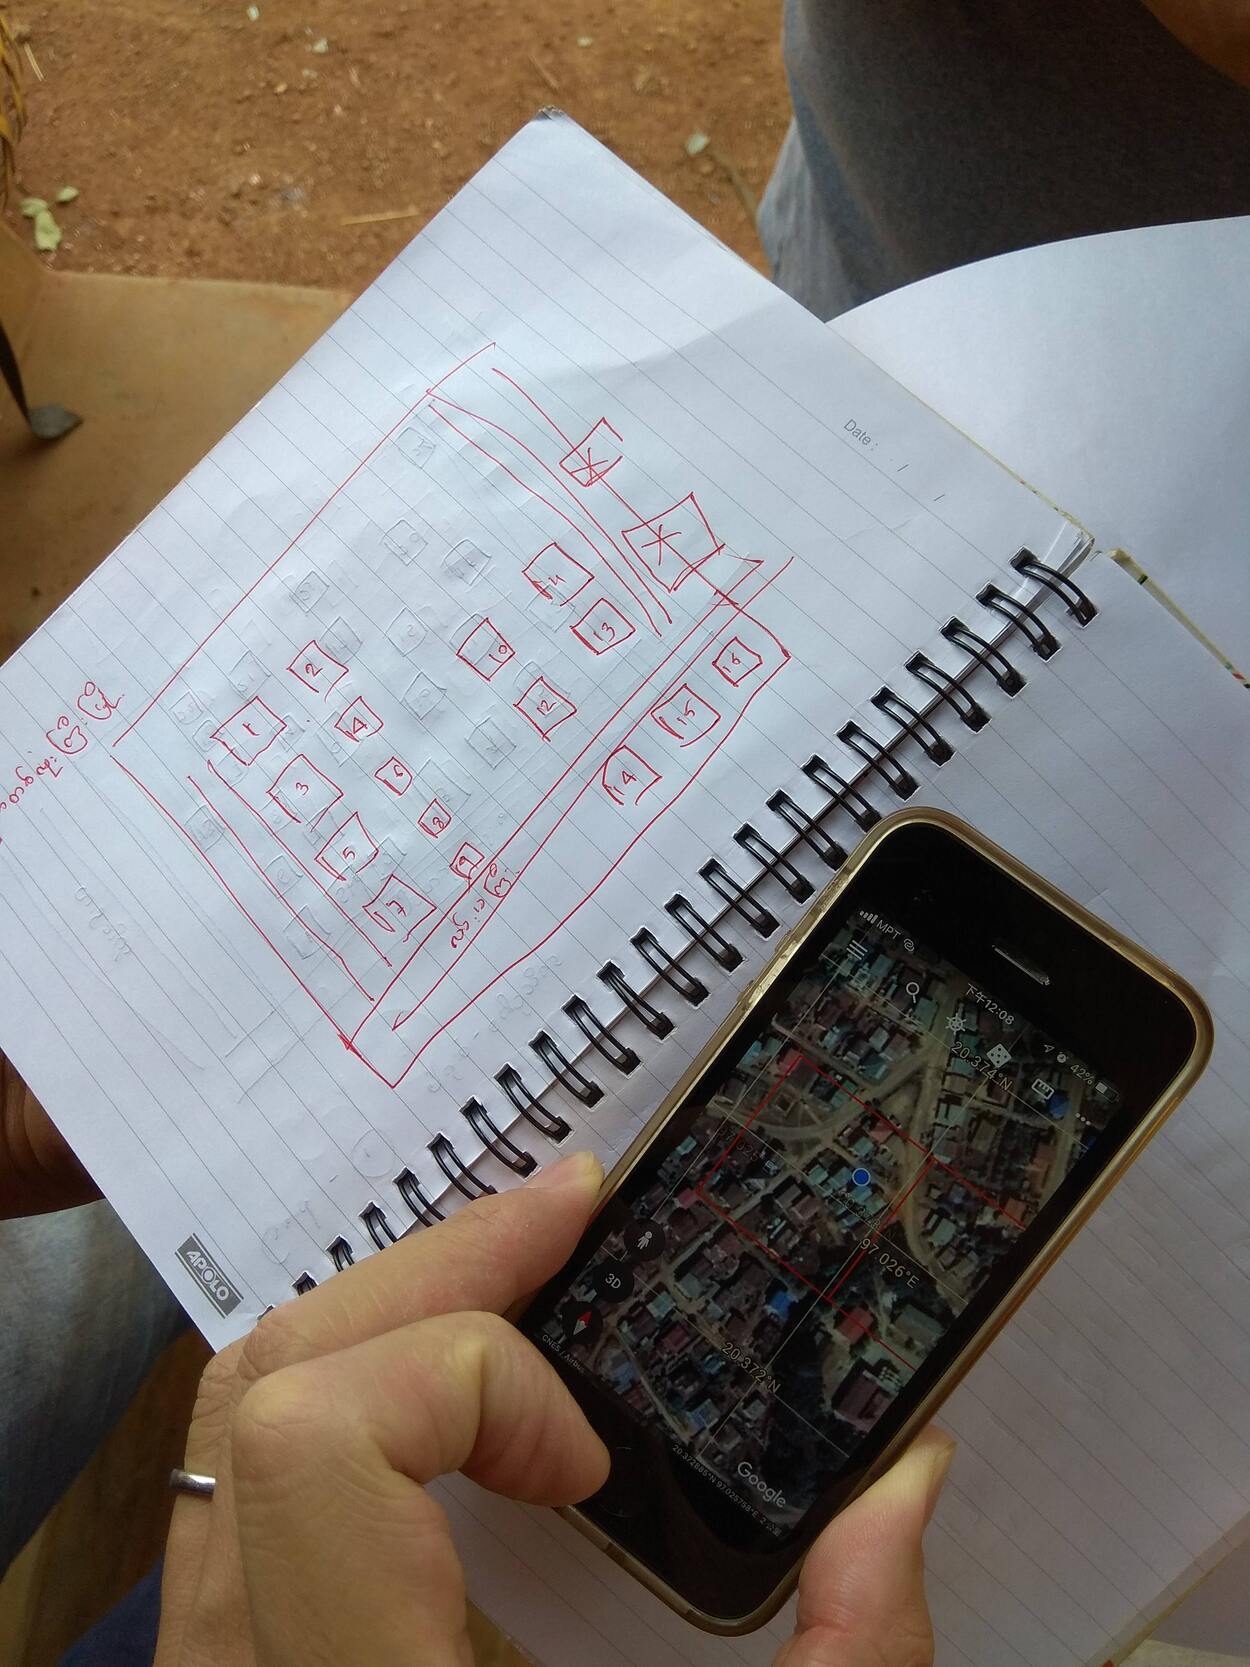
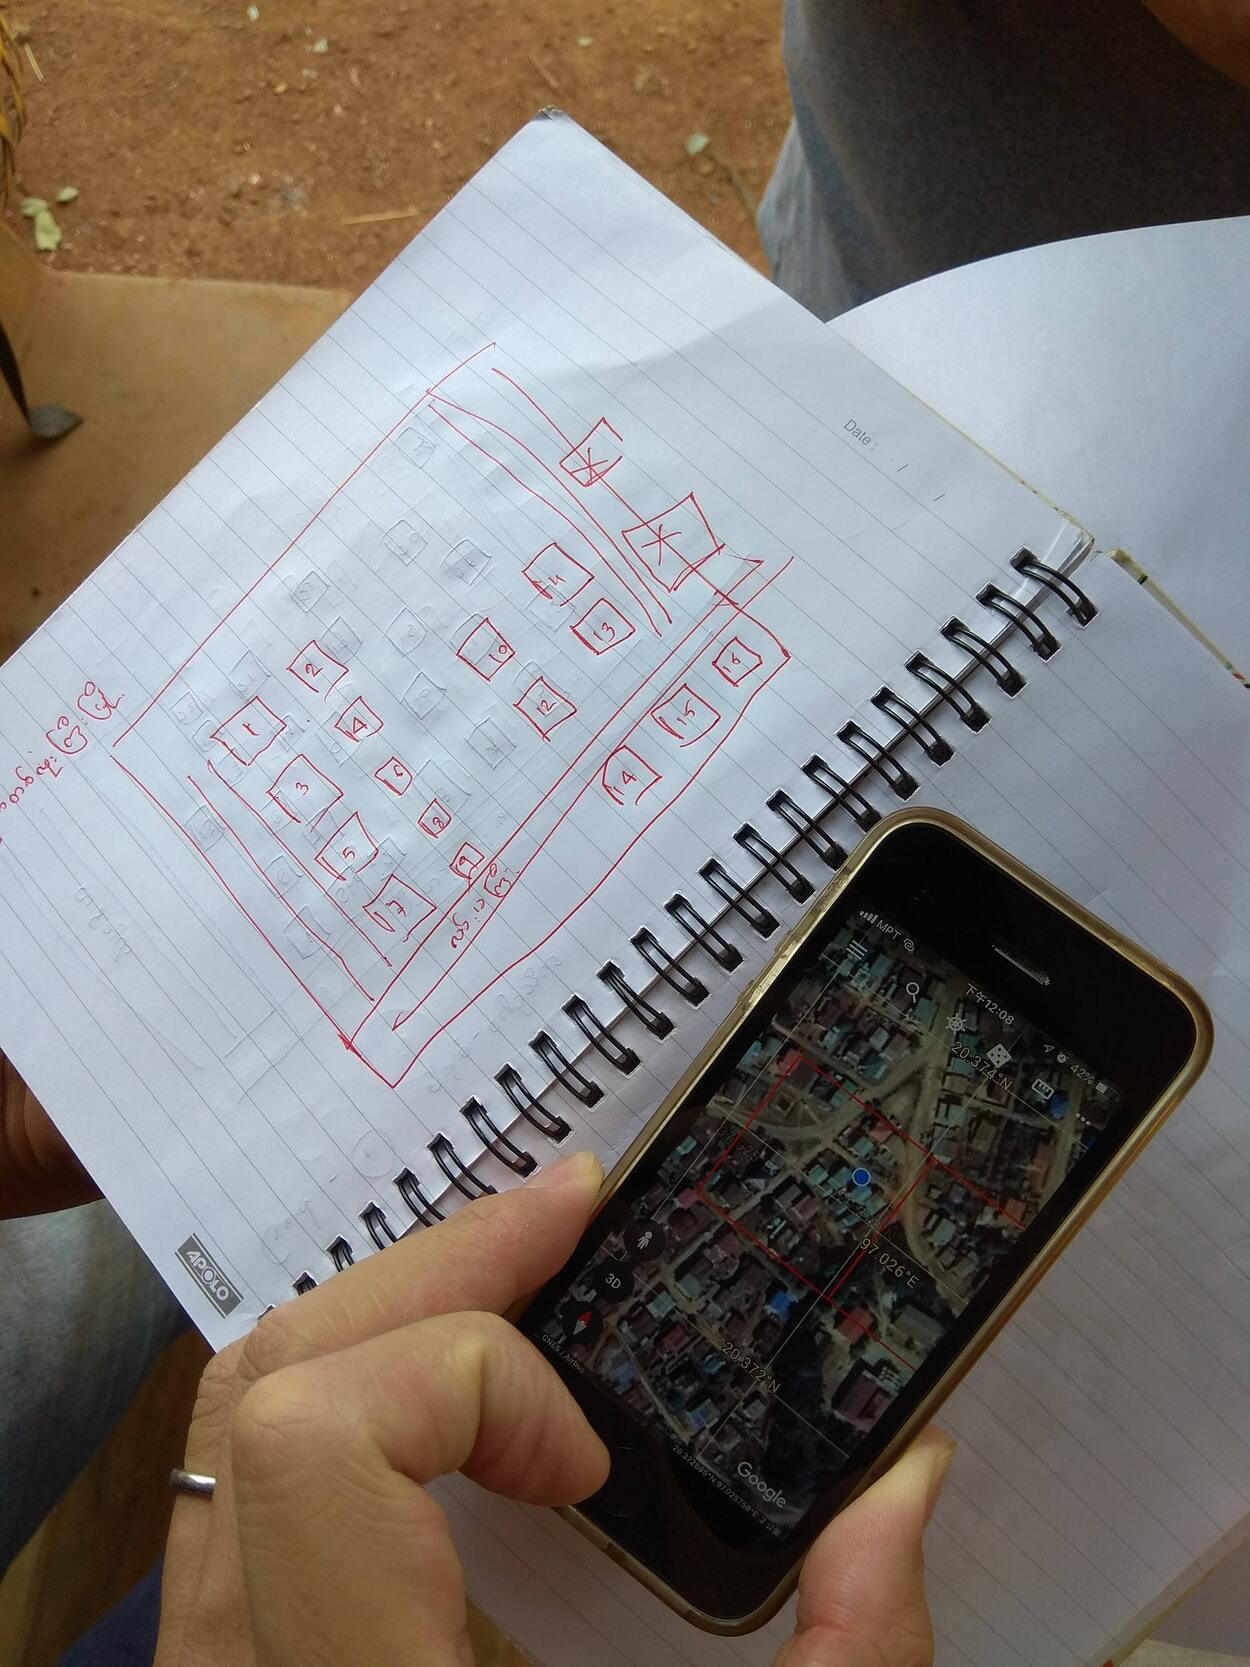
In Figure 1, we outline the sequence we used to replace the final stage of the PPS design while keeping the rest of the multistage PPS structure intact. Figure 2 is the actual hand-drawn map of one of the sampled grids, created during ABS’s Myanmar survey fieldwork in one of the pre-drawn small grids.
Field Implementation and Quality Control
We use the Myanmar fieldwork to present the clearest field test, as the full fieldwork process can be described in detail[5]. The survey covered the accessible parts of all 14 states and regions plus Nay Pyi Taw. Three broader areas were excluded before fieldwork because of intense fighting between the Myanmar armed forces (Tatmadaw) and ethnic armed organisations (EAOs). During fieldwork, two sampled townships had to be replaced when local armed actors or local authorities did not permit interviewing, and two small grids were also replaced because they could not be accessed in the area due to ongoing military conflict. These changes followed pre-prepared alternatives rather than ad hoc substitutions in the field.
The fieldwork team travelled as units and included ethnic minority interviewers. Each household interview lasted about 45 minutes to 2 hours. The ABS project also used a multi-contact approach to improve co-operation and contact rates. The reported refusal rate was 24 percent, based on 390 refusals out of 1,627 cases logged in the field records.
Quality control was built into the field process rather than added later. Supervisors cross-checked one third of interviews in each village or ward and reviewed questionnaires before teams left the field site. Respondents were also given stamped postcards to confirm participation, and 147 postcards were returned. A structured re-test was used to assess sampling reliability[6]. The re-test used a shorter questionnaire, and neither the original interviewer nor the same supervisor was allowed to handle the same respondent again. Only four retests (1.7 %) of the retested cases showed major inconsistencies, and all of that interviewer’s cases were redone. These figures do not eliminate concern about field error, but they indicate that the design was tight enough to audit and, when necessary, to correct. We report Myanmar implementation and quality-control indicators in Table 2.
The Chinese design followed the same logic. The final stage shifted from name lists to sampled geographic cells, most of the repetitive preparation work was moved into scripted office workflows, and local teams carried a clearer set of field instructions into sampled areas.
Assessing Feasibility with External Benchmarks
Feasibility cannot be judged from field completion alone. A design can be orderly and still drift away from the population. We therefore examined whether weighted sample distributions were close to independent population benchmarks.
Post-survey weighting adjusted the data for age, gender, and geography. In Myanmar, weighting used region-rural strata in the first stage and gender-age cells in the second stage. To assess how well the weighted samples tracked known margins, we compared sample and population distributions using chi-squared goodness-of-fit tests for religion and education level. The results are presented in Table 3.
The weighted Myanmar sample tracked the external benchmarks closely on both variables reported here. The share with college education or above was 9.83 percent in the sample and 10.00 percent in the benchmark population, with no statistically significant difference. The weighted share identifying as Buddhist was 86.78 percent in the sample and 88.00 percent in the benchmark population, again with no statistically significant difference. These are modest tests, but they matter because neither variable is mechanically guaranteed by the grid design itself. They show that a sample built through the GIS/GPS procedure, and then weighted in the usual way, can reproduce broad educational and religious composition reasonably well.
The China results are similarly instructive. The weighted share with college education or above was 18.52 percent in the sample and 19.00 percent in the benchmark population, with no significant difference. That result is consistent with the claim that the design can recover a broad social margin even in a politically constrained setting. The Chinese Communist Party (CCP) party membership comparison is different. The weighted share of CCP members was 11.58 percent in the sample compared with a 9 percent benchmark share, and the goodness-of-fit test was significant at p < .01. That difference, however, is not unique to our survey. Other Chinese survey-based studies have also reported Party-member shares in the low teens, including Munro’s nationwide survey (Munro 2018), the China General Social Survey (CGSS), and the China Household Finance Survey (CHFS) (Nikolov et al. 2020; Targa and Yang 2024; Zhang and Gao 2024), which suggests a broader pattern in survey measurement rather than a problem specific to our grid-based household-selection procedure alone[7].
All in all, this pattern is useful for practitioners. A feasible design does not need to match every benchmark perfectly to be worth using. What matters is whether it performs well enough on several independent margins to justify continued use, ensures the probability-based sampling design with ease, and shows researchers where extra caution is needed. On that standard, the evidence is encouraging. In both countries, the design produced weighted samples that were close to benchmark values on higher education. In Myanmar, it also reproduced the religious distribution closely. In China, although the weighted share of CCP members in our sample exceeds the official benchmark, it is very close to the shares reported in other large-scale probability-based social surveys. On that evidence, the method appears capable of producing results similar to those obtained by established probability surveys.
Lessons for Other Surveys
We believe that four practical lessons come out of the work.
First, we only replaced the last and weakest stage of the PPS design, not the whole sampling method. In both countries, we kept PPS selection at the upper levels and changed only the stage that depended most heavily on household rosters, which were either non-existent or within the government’s strict control. That reduced disruption and kept the design legible.
Second, we still separated navigation from selection. GPS helps interviewers reach the sampled cell. It does not by itself create a probability sample. The probability element comes from the PPS selection of grids, the documented removal of uninhabited cells in the office, the fixed household-listing rule inside the grid, and the Kish selection within the household.
Third, under a difficult setting, regardless of whether the threats are political or environmental, prepare replacements before the field team needs them. Conflict, local refusals, and administrative blockage are predictable possibilities in hostile or constrained settings. Ordered alternatives, aided by programmed automation, preserve the design more effectively than field improvisation.
Fourth, if possible, executing the benchmark comparisons (as shown in Table 3) is useful because it shows where the design holds and where it still struggles. That is the right way to judge a method that is meant to be practical rather than perfect.
Our lessons learned from the 2018 and 2019 Chinese and Myanmar surveys fit broader guidance on comparative survey quality, which stresses that sampling, field implementation, and documentation have to be considered together rather than as separate tasks (AAPOR/WAPOR Task Force 2021). Future survey-methods research could build on this by testing whether grid-based designs also improve coverage of groups often missed by weaker list-based or more discretionary final-stage methods, including migrants, floating populations, and households omitted from incomplete local registers.
Conclusion
Household name lists are not the only way to preserve probability sampling in face-to-face surveys. When those lists are weak, inaccessible, or politically risky to use, a grid-based PPS design can provide a workable substitute. In Myanmar and China, the combination of gridded population data, digital boundaries, GPS navigation, and explicit within-grid rules let us keep the final stage of selection transparent. The field evidence and the benchmark comparisons from both countries suggest that this approach is feasible for serious survey work, provided that the project also invests in supervision, ordered replacements, and post-survey evaluation. We hope our efforts encourage the survey researchers to utilise GIS technology and programming to overcome the political and environmental burdens and bring out the true voices from these “difficult” regions.
Corresponding author contact information
Osbern Huang, School of Government & International Relations, Griffith University, Glyn Davis Building (N72), Room -1.34, 170 Kessels Road, Nathan QLD 4111, Australia. Email: o.huang@griffith.edu.au.
Acknowledgement
The authors would like to acknowledge with deep gratitude the fieldwork teams in Myanmar and China whose dedication made this research possible. In Myanmar, we especially thank our colleagues at the Yangon School of Political Science/Myanmar Political Science Association for their professionalism, endurance, and care in carrying out difficult fieldwork under demanding conditions. In China, we likewise thank the survey teams drawn from multiple collaborating universities for their commitment and skill. Without the immense efforts of these teams, the Asian Barometer Survey could not have collected these precious first-hand data. We remain sincerely grateful for their work and hope to have the opportunity to work with them again soon in both countries.
After the fourth wave (the present study), ABS ceased the coverage of Myanmar and China due to the direct political considerations, which are unsolvable by the sheer advancement of technology. To learn more about the topics, country coverage, and the status of the Asian Barometer Survey, please visit the project website: https://www.asianbarometer.org/
The Google Maps service is unavailable, and due to restrictions on geographic data in China, we need to transform our WGS-84-based coordinates to China’s GCJ-02 system. After the transformation, interviewers can finally view the geographic coordinates of the selected small grids.
During our fieldwork in 2019, we replaced two sampled sites due to domestic conflict in Shan state, Myanmar. Therefore, this occasion sounds rare but is far from impossible.
For the detailed workflow and descriptions of our Python and Bash programs, please refer to Appendix A.
We cannot share the same level of detail on our Chinese survey’s fieldwork because of political risks.
Immediately after the main fieldwork, 27 townships (25 percent of survey areas) were randomly selected for re-testing. Within those townships, one-third of the completed interviews from one sampled ward or village was re-contacted, yielding 238 retests, or 14.7 percent of the national sample. The authors also joined the re-test process as foreign observers in six villages. In those observed cases, the re-test procedures were carried out to a high standard, with the replacement teams following the prescribed protocols for respondent verification and short-form questionnaire administration.
Published survey-based estimates are often closer to our result than to the official total-population Party-membership rate. Munro (2018), using a nationwide China survey, reports an unweighted Party-member share of 12.6 percent and argues that refusal-bias correction improves the estimate. A recent CGSS-based study reports 11.33 percent Party members in the 2017 China General Social Survey (Zhang and Gao 2024), and another study using CGSS 2013 reports 11.69 percent (Nikolov et al. 2020). A recent World Development article also notes that survey-based estimates from national Chinese social surveys, including CHFS-based work, often fall in the low-teen range (Targa and Yang 2024). These figures are not perfectly comparable because they differ by year, weighting, denominator, and sample definition, but they do suggest that the low-teen pattern is not peculiar to our data. More work is needed to determine whether this recurring gap reflects adult-population denominators, differential participation, disclosure on politically sensitive items, post-stratification limits, or some combination of these factors. We hope future survey-methods research on China will examine this pattern more directly.