Introduction
Over the past few decades, and especially in more recent years, survey participation across academic disciplines has declined in the United States and elsewhere (Arfken and Balon 2011; Cavari and Freedman 2023; Dutwin and Buskirk 2020; Eggleston 2024; Galea and Tracy 2007; Williams and Brick 2017). Falling survey response rates have been observed for different survey modes, suggesting that the underlying cause of decreasing participation extends beyond interview mode. These declines, in turn, have contributed to lower panel recruitment rates – the proportion of individuals who agree to join a longitudinal study following an initial invitation (Connelly, Brown, and Decker 2003; Jabkowski and Cichocki 2025; Kocar and Kaczmirek 2024; Shiyab et al. 2023; Stedman et al. 2019). Low participation is especially pronounced among ethnic minorities, individuals of low socioeconomic status, and other hard-to-reach groups, undermining both the representativeness and equity of survey data (Lett, Orji, and Sebro 2018; Törnävä et al. 2025).
In response, survey methodologists have investigated ways to counteract declining recruitment rates and improve participation among hard-to-reach groups. Much of this work involves experimental testing of recruitment modes (online vs. letter-based), materials (variations in letters or envelopes), and incentive structures (sign-up vs. completion incentives, cash vs. gift cards). Empirical evidence points to modest gains from envelopes with visible cash or those marked as Priority Mail (Bilgen et al. 2023; DeBell 2022; Zhang et al. 2023), shorter and clearer invitation materials (Dillman, Smyth, and Christian 2014; Greenberg and Dillman 2021), online-only enrollment (Cornesse et al. 2022), and cash incentives (Witte et al. 2023), though these findings are not always consistent across studies and contexts (Felderer and Herzing 2023; McGregor et al. 2022).
While this literature has generated valuable insights, most studies are guided by prior quantitative evidence on general strategies to enhance participation rather than by qualitative testing of recruitment materials themselves. Rarely, if ever, are the experimental recruitment materials subjected to qualitative testing before deployment. Moreover, much of the existing research focuses on improving survey response rather than panel recruitment, and the limited evidence on panel recruitment often comes from non-U.S. samples.
In this study, we adopted a mixed-methods approach to improve and experimentally evaluate the invitation letter and newly developed Frequently Asked Questions (FAQs) used for recruitment into the Understanding America Study (UAS), a nationally representative probability-based online panel. First, we conducted qualitative data collection to identify potential improvements to existing and new recruitment materials, and iteratively refined their content and format based on participant feedback. Second, we implemented a randomized experiment comparing recruitment outcomes using the original and revised versions of the recruitment materials.
Recruitment in the Understanding America Study
Established in 2014 at the University of Southern California, the UAS is a probability-based nationally representative internet panel of about 15,000 U.S. individuals. Recruitment into the UAS is carried out in batches, using United States Postal Service delivery sequence files as the sampling frame. Panel members are provided with a tablet and an internet connection, if necessary, to ensure their participation; they are invited to complete about two surveys per month and are compensated for each survey they complete. Surveys cover a wide range of topics, including health, work, finances, family, and current events.
Households selected for recruitment into the UAS are sent a Priority Mail envelope containing the invitation letter and FAQs about the panel,[1] a $5 cash incentive, and an initial recruitment survey that can be completed either online or on paper and returned using a prepaid envelope (Understanding America Study 2025). The invitation offers a $15 reward upon completion of the initial recruitment survey. At the end of the recruitment survey, respondents indicate whether they agree to join the UAS panel to complete online surveys regularly. Those who consent to join the UAS after completing the recruitment survey online are directed to the UAS portal, where they can answer a short demographic survey and formally enroll as panel members. Consenters who return the initial survey on paper receive a welcome package by mail with their UAS login credentials. After logging into the portal and completing the demographic survey, they are officially enrolled as panel members.
Data and Methods
Qualitative testing of the invitation letter
To assess the clarity and effectiveness of our UAS recruitment materials and elicit suggestions for improvement, we employed a sequential qualitative design combining six focus groups and eight in-depth interviews (all conducted between December 2021 and April 2022). The number of focus groups was informed by findings from prior empirical studies indicating that, when research questions are narrow, code saturation can be reached with between four and eight groups and as few as two groups per population sub-group (M. Hennink and Kaiser 2022; M. M. Hennink, Kaiser, and Weber 2019). The number of interviews, our secondary qualitative method of inquiry, was primarily determined by time. However, it is in line with the small samples in prior studies using interviews to pre-test research materials (Blair and Conrad 2011).
The six focus groups (6–8 participants, 90 minutes each) were conducted to gather broad perspectives and suggestions for improvement on two versions of the invitation letter that had been used for recruitment into the UAS up to that point: (1) a paper+web letter, included in the recruitment package at the time of qualitative data collection, which invited respondents to complete a paper version of the first survey enclosed in the envelope and offered an online alternative; and (2) a push-to-web letter, used in earlier recruitment efforts, which directed respondents exclusively to the online version of the survey, with a paper option available only upon request.[2]
Focus group participants were recruited from the U.S. adult population by a qualitative recruitment firm. The group discussions were moderated by one of the authors (Lila Rabinovich). Each participant received a $75 incentive. The focus groups were stratified to ensure that populations with lower participation rates in the UAS were adequately represented. Specifically, two groups were conducted in Spanish with Hispanic adults ages 18 and over; two groups with low education (high school or less) adults ages 30 and under; and two groups with older adults ages 70 and over. No other screening criteria were applied.
Following the focus groups, a revised invitation letter with FAQs on the reverse side was developed based on the insights gained. Subsequently, in-depth interviews were conducted to elicit detailed, point-by-point feedback on content, wording, layout, and comprehension of the original and revised materials. To this end, a convenience sample of eight participants was recruited from a registry of study volunteers maintained by the University of Southern California. These are individuals who voluntarily sign up with a research volunteer registry housed within USC who are interested in participating in studies conducted by USC researchers. This sample was mostly female (n = 5), white (n = 6) and older (four were 60+). Interviews were 25-30 minutes long, and interviewees were paid $40 for their time. Both focus groups and interviews were conducted online.
This combined approach allowed us to first obtain general reactions and group-level insights into how diverse audiences perceived the UAS invitation letter. We then complemented these insights with in-depth, individual line-by-line assessments of both the revised invitation letter and newly developed FAQs. Together, these methods strengthened the validity of our findings and informed revisions aimed at improving clarity, inclusivity, and participant engagement.
Evaluation: Randomized Experiment Comparing Original versus Revised Invitation Letter
To evaluate the effectiveness of the revised invitation letter relative to the original paper+web version, we implemented a randomized experiment using a batch recruited in January 2023. Among 5,000 selected addresses, half were randomly assigned to receive the new invitation letter, while the other half received the original letter. Sample addresses were selected using the standard UAS adaptive sampling algorithm.[3] The recruitment batch size (n = 5,000) reflects the panel’s usual practice, providing sufficient statistical power to evaluate recruitment experiments while remaining within budgetary constraints. The impact was evaluated using two-tailed independent-sample t-tests on the overall (unconditional) recruitment rate and the conditional probabilities associated with each recruitment stage: (1) returning the initial recruitment survey, (2) agreeing to join the UAS after returning the recruitment survey, and (3) completing enrollment among those who agreed to join. A small number of mailings were returned as undeliverable; after excluding these cases, the final sample size was 4,708.
To further understand potential pathways through which the revision of the invitation letter might lead to different empanelment rates, we conducted causal mediation analysis using logistic regression (Nguyen, Schmid, and Stuart 2021). Because individuals who completed the initial survey online and agreed to join the panel were immediately directed to the UAS portal to finalize enrollment, and since the revised letter included a QR code linking to the online survey, we hypothesized that the revised letter’s potential impact might be mediated by whether participants completed the survey online or on paper. Therefore, for the mediation analysis, we limited the sample to participants who returned the initial survey. We also analyzed potential differences in the demographic composition of the empaneled members across the letter groups using a Pearson’s chi-squared test. All analyses were conducted using Stata 16.0. Results were considered statistically significant if p < 0.05.
Results
Qualitative insights
Four broad themes emerged from the focus groups: (1) motivation from opportunities for future paid surveys, (2) confusion about data use and privacy, (3) perceived need for easier access to the initial survey online, and (4) concerns about the length, complexity, and formatting of the invitation letter. These four themes shaped most of the feedback on the recruitment materials, which we describe below.
First, participants did not always understand that completing the initial recruitment survey would open the opportunity for future paid surveys as panel members. When this was clarified, participants saw the prospect of additional paid surveys as a desirable incentive that could enhance engagement. Second, participants expressed concerns about the potential misuse or unauthorized sharing of their personal information. Moreover, although the university affiliation of the recruitment materials was reassuring, many worried that the surveys might request sensitive information, such as Social Security numbers or employer details. Participants recommended including clearer, plain-language explanations of data privacy and use in the recruitment materials. They also emphasized the importance of stating that their information would never be sold to commercial entities but would be used solely for research addressing policy-relevant questions. Third, participants—particularly young adults and those in the Spanish-speaking focus groups—suggested including a QR code as an additional way to access the online recruitment survey, noting that it could facilitate quicker and easier access for those comfortable with the technology. Additionally, several participants, especially older adults, remarked on the importance of including a paper survey in the recruitment package to accommodate those with lower internet literacy or comfort. Finally, participants reported that the invitation letters were overly lengthy and could be streamlined. They suggested that adding visual elements and highlighting key information (e.g., the opportunity to participate in future paid surveys) could help engage recipients who might be reluctant to read the materials in full.
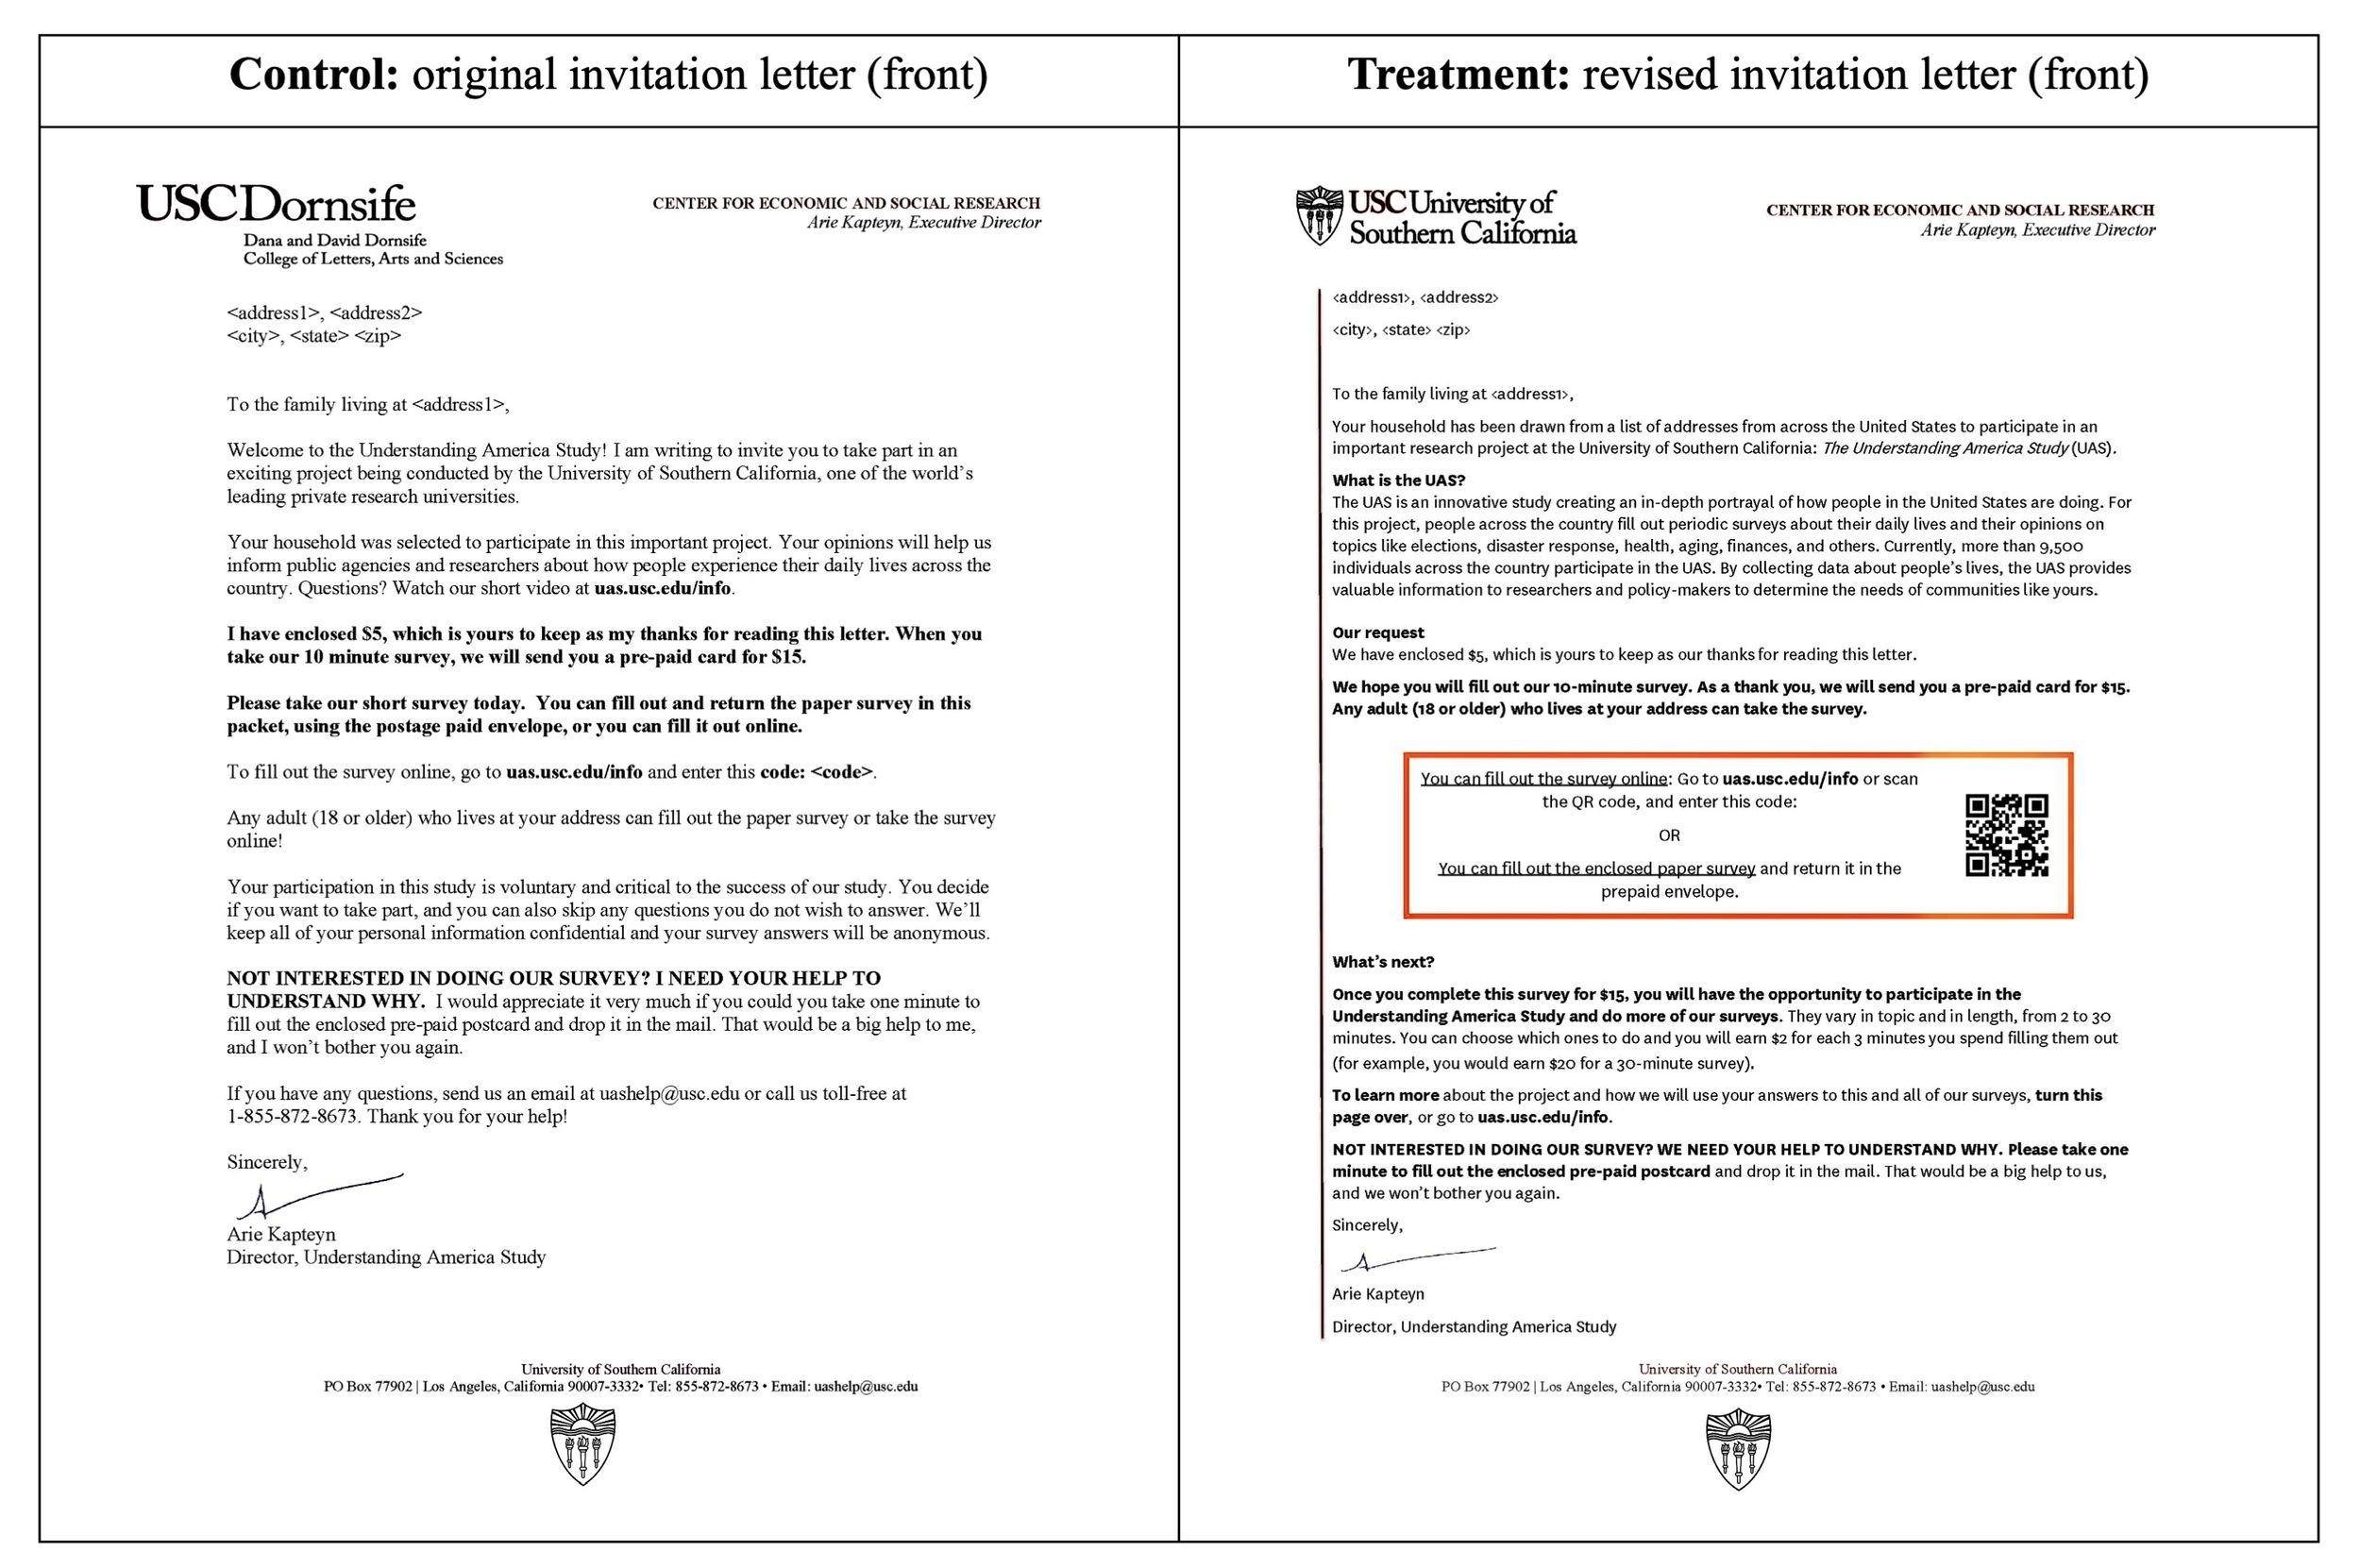
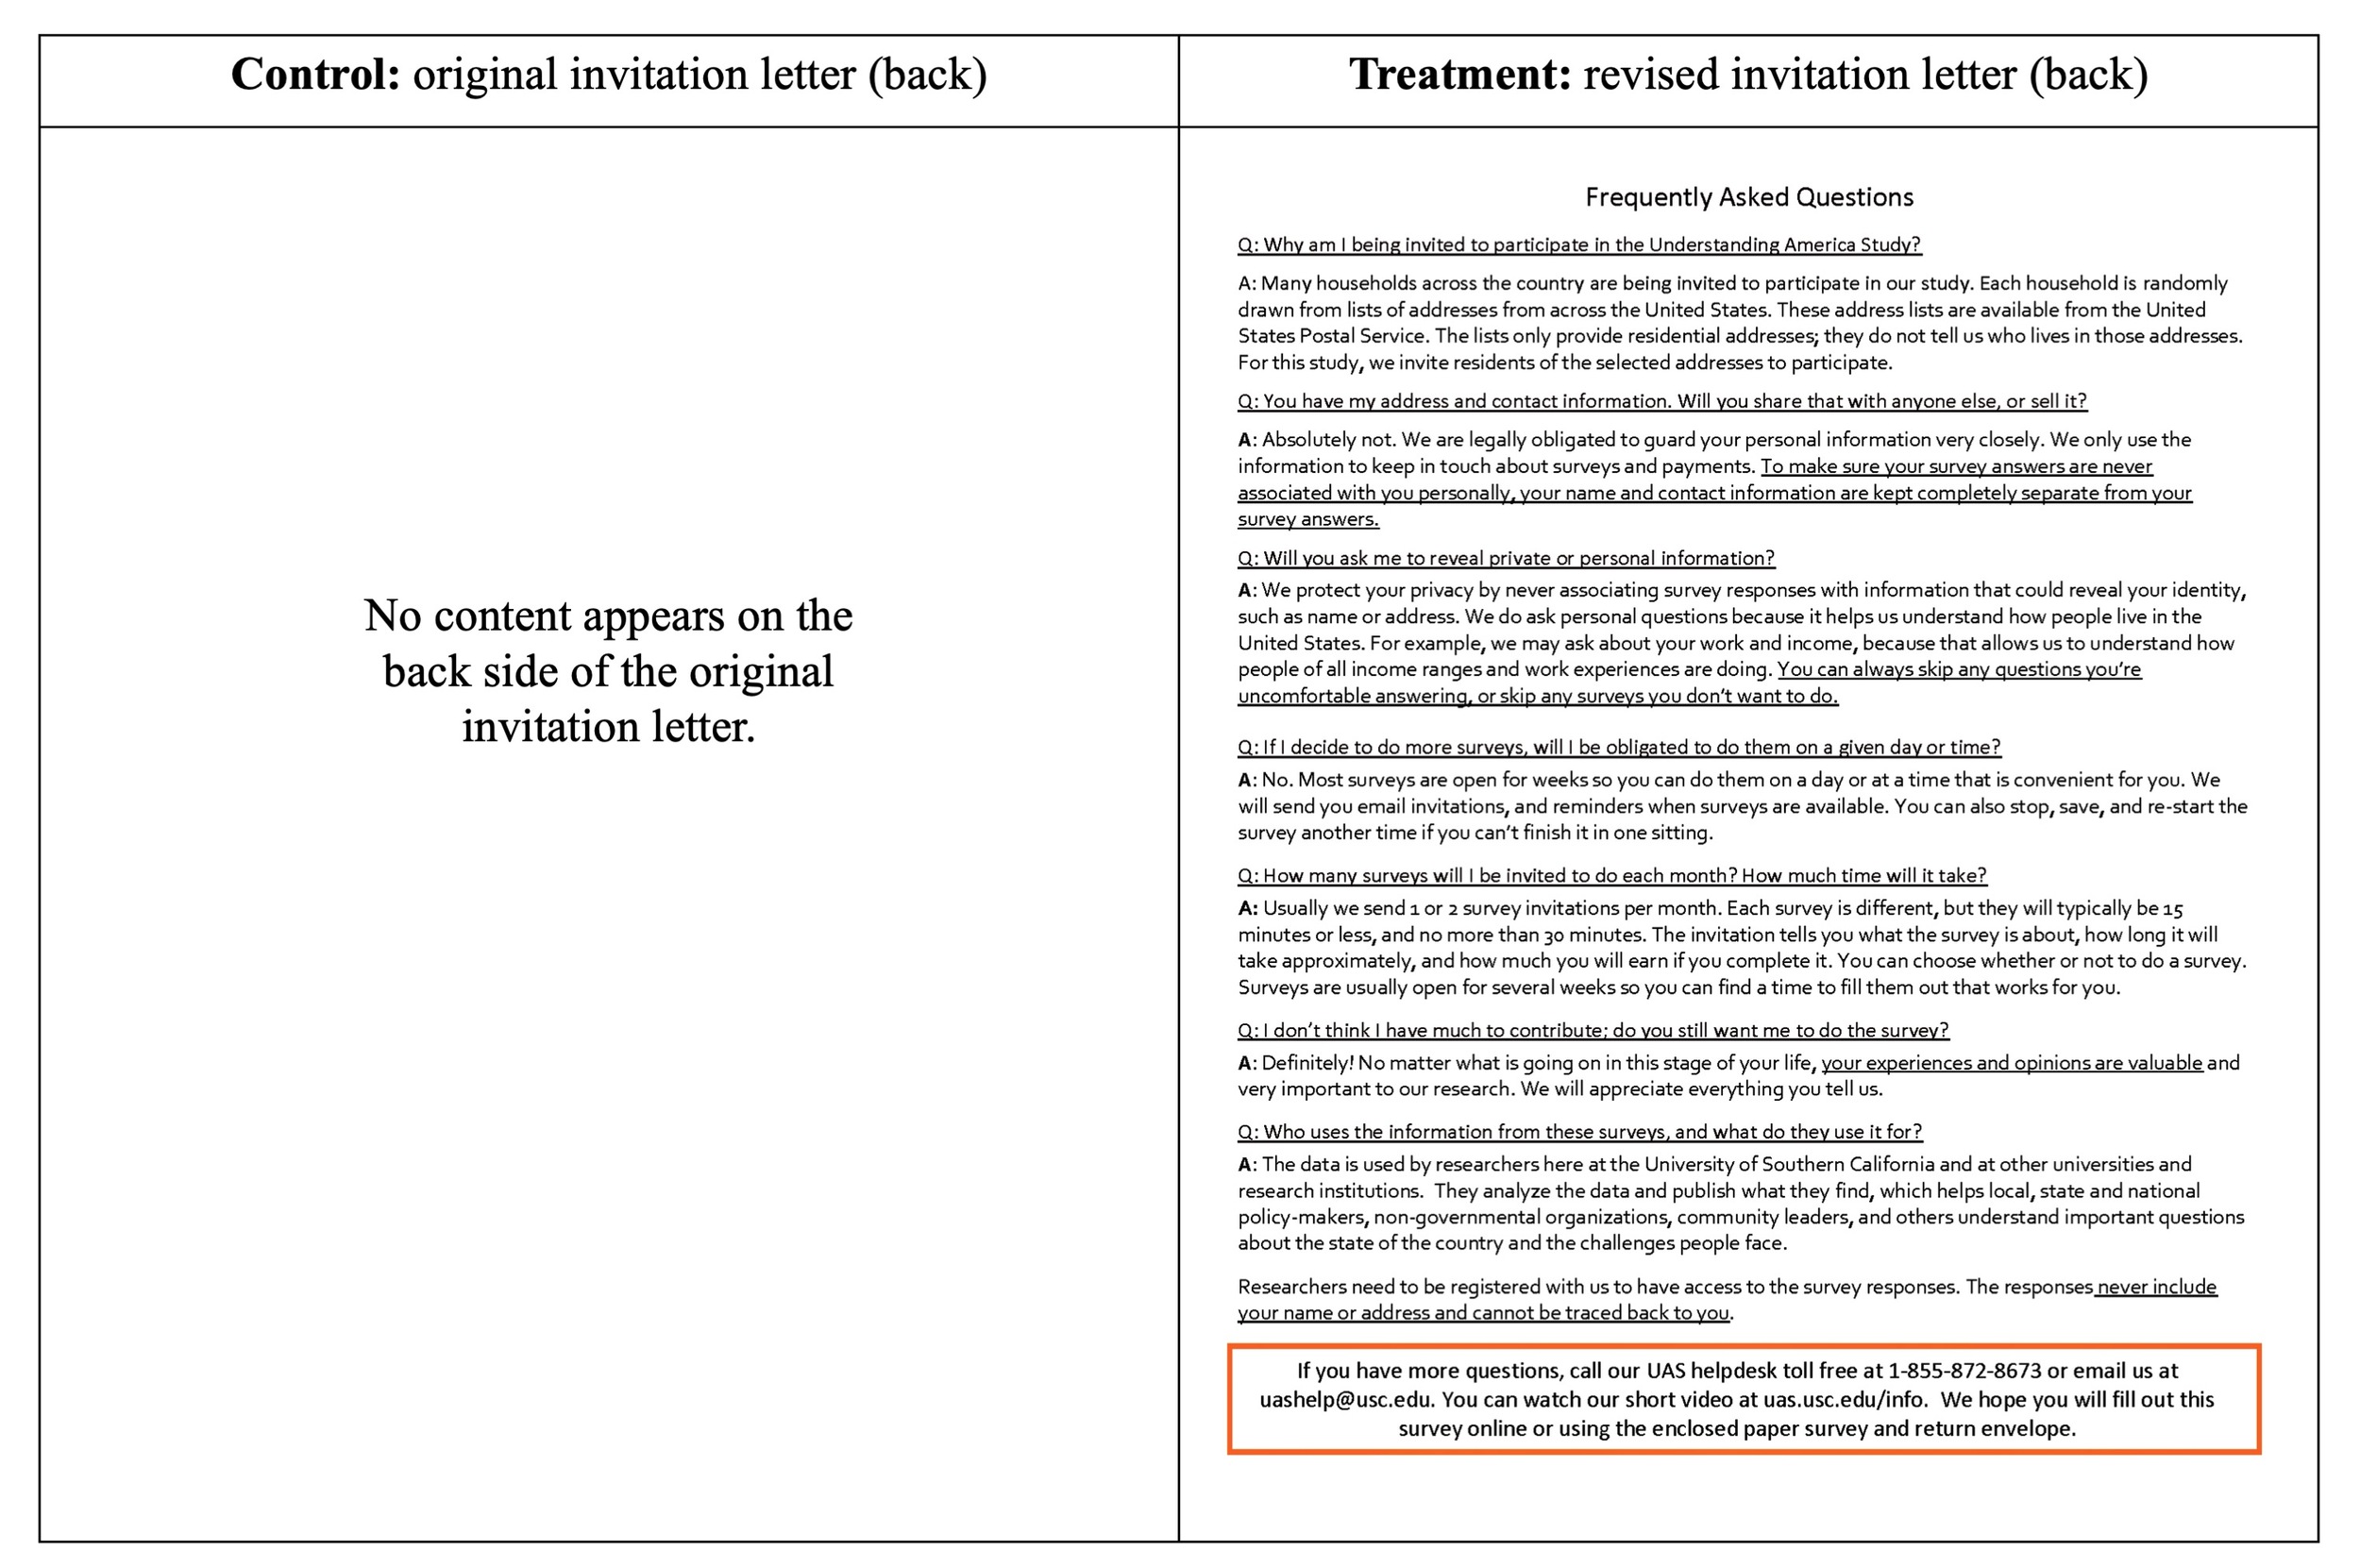
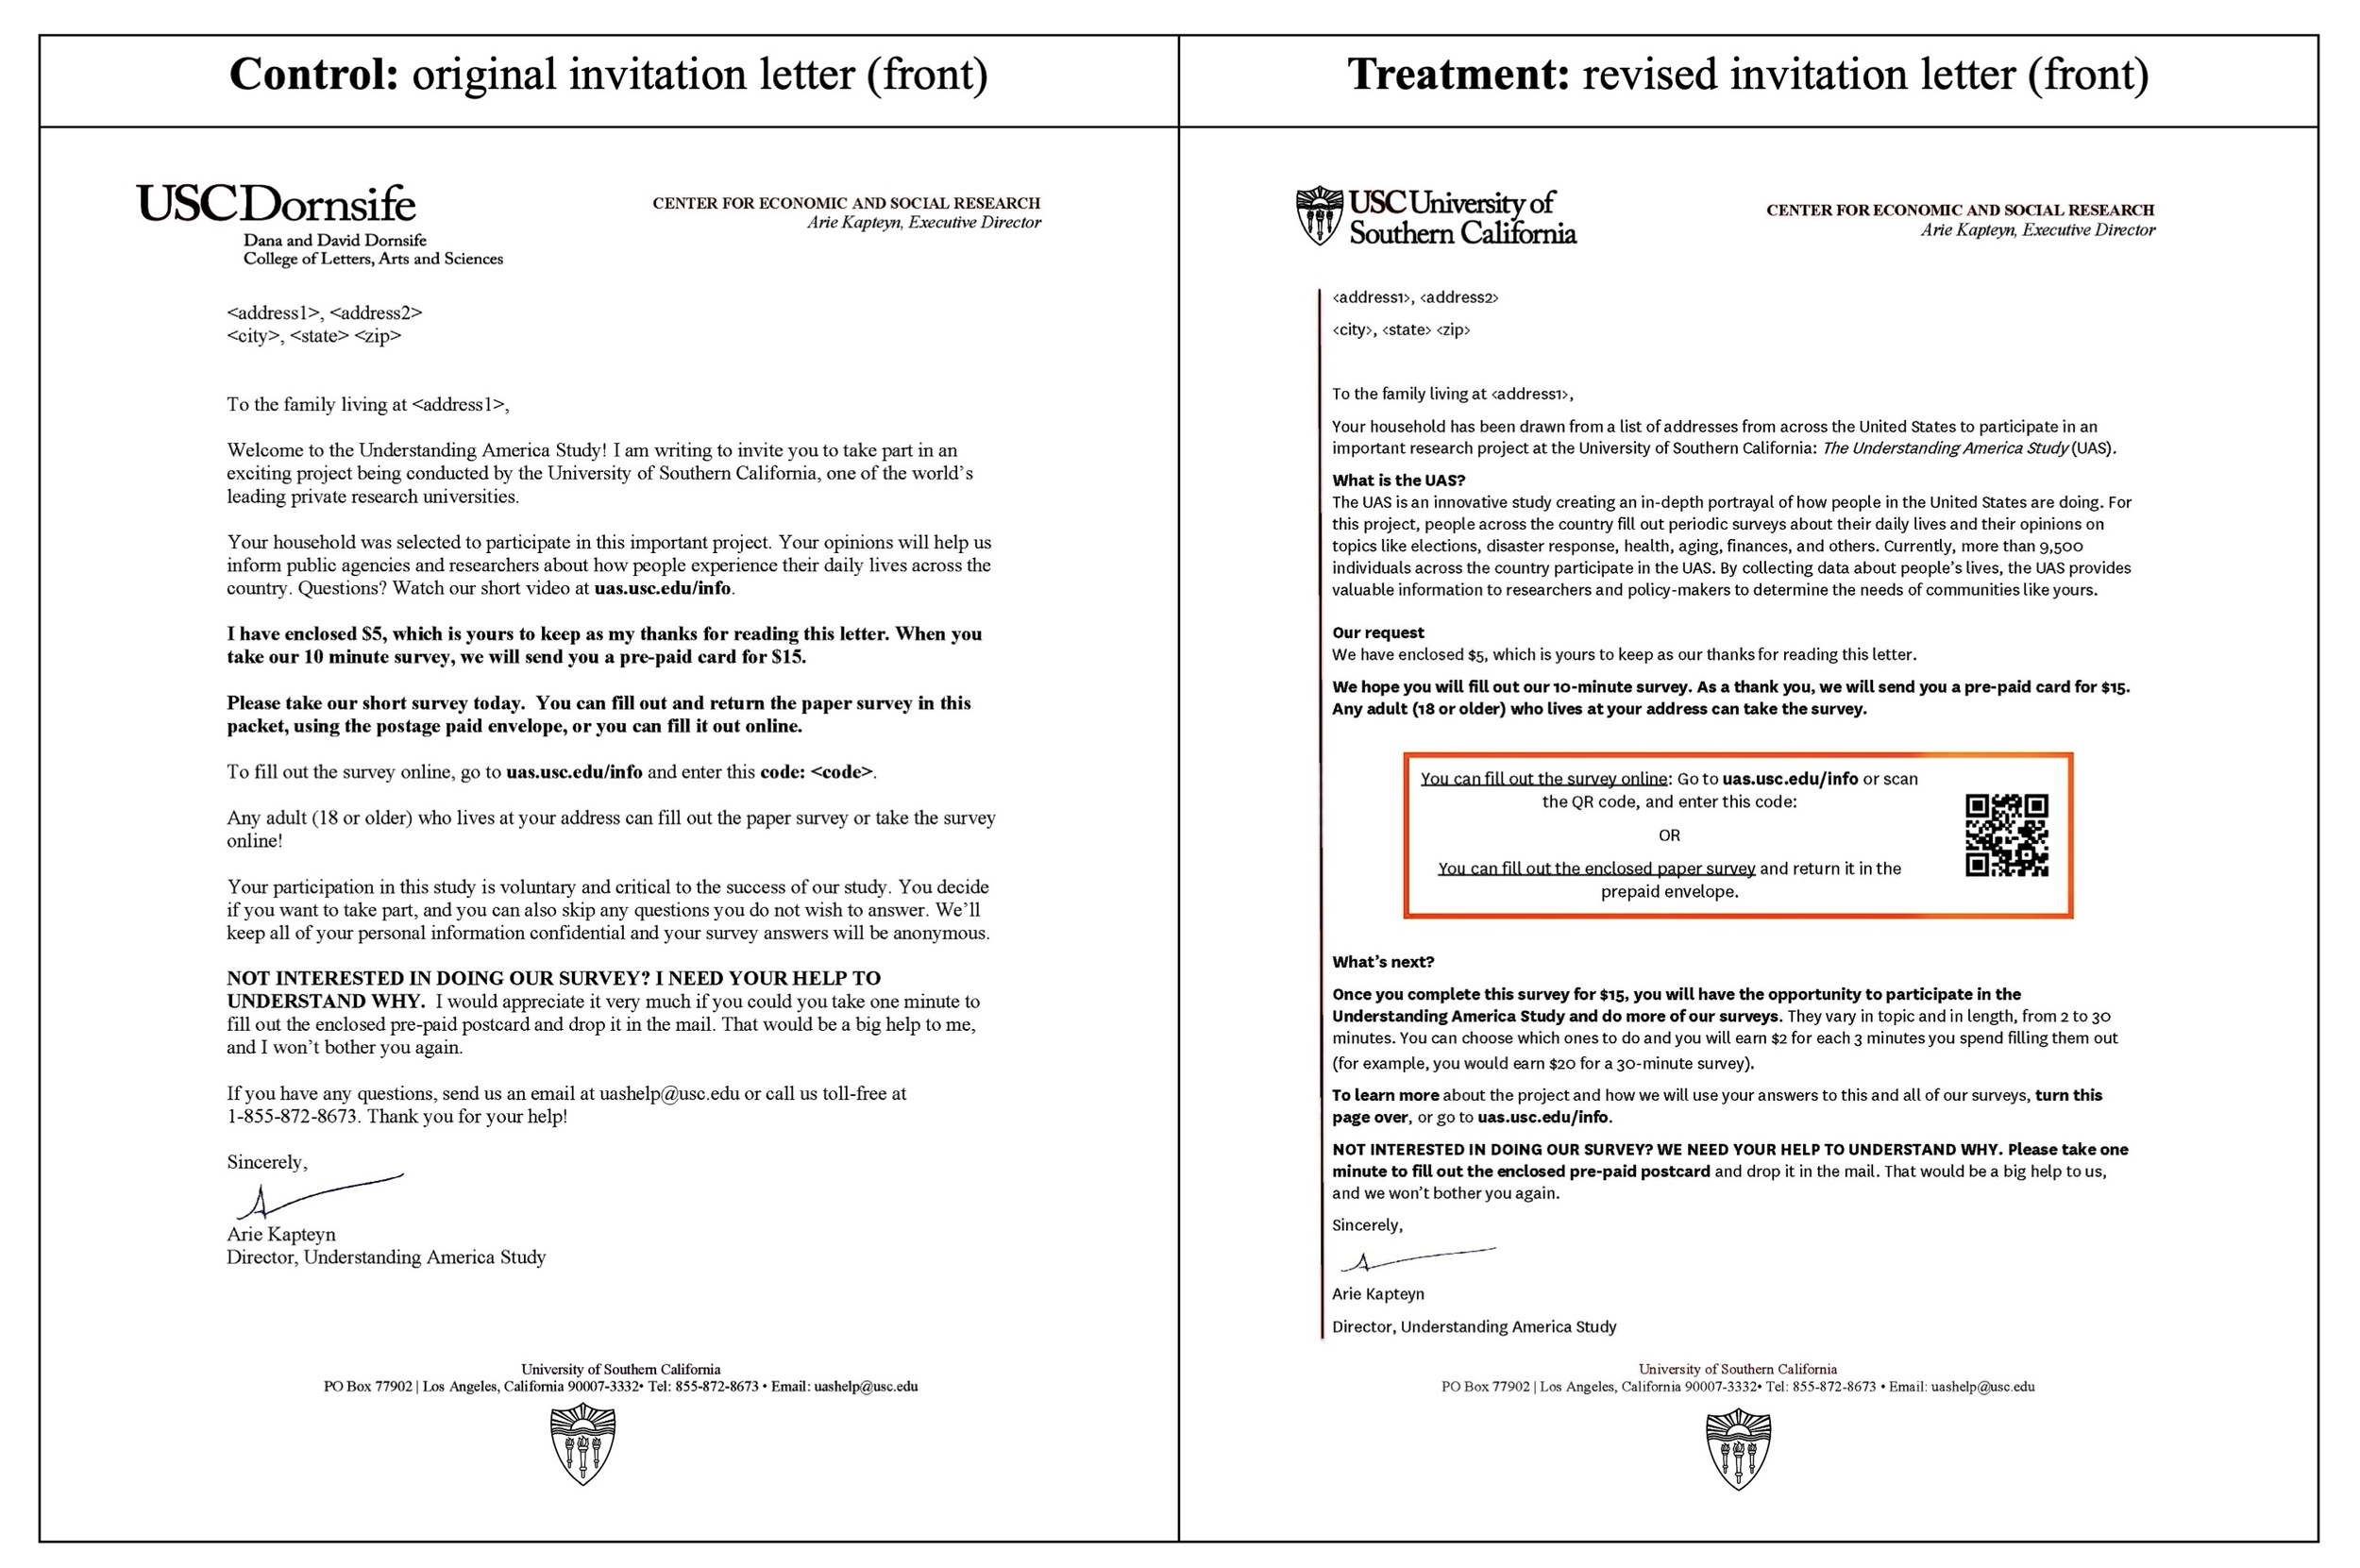
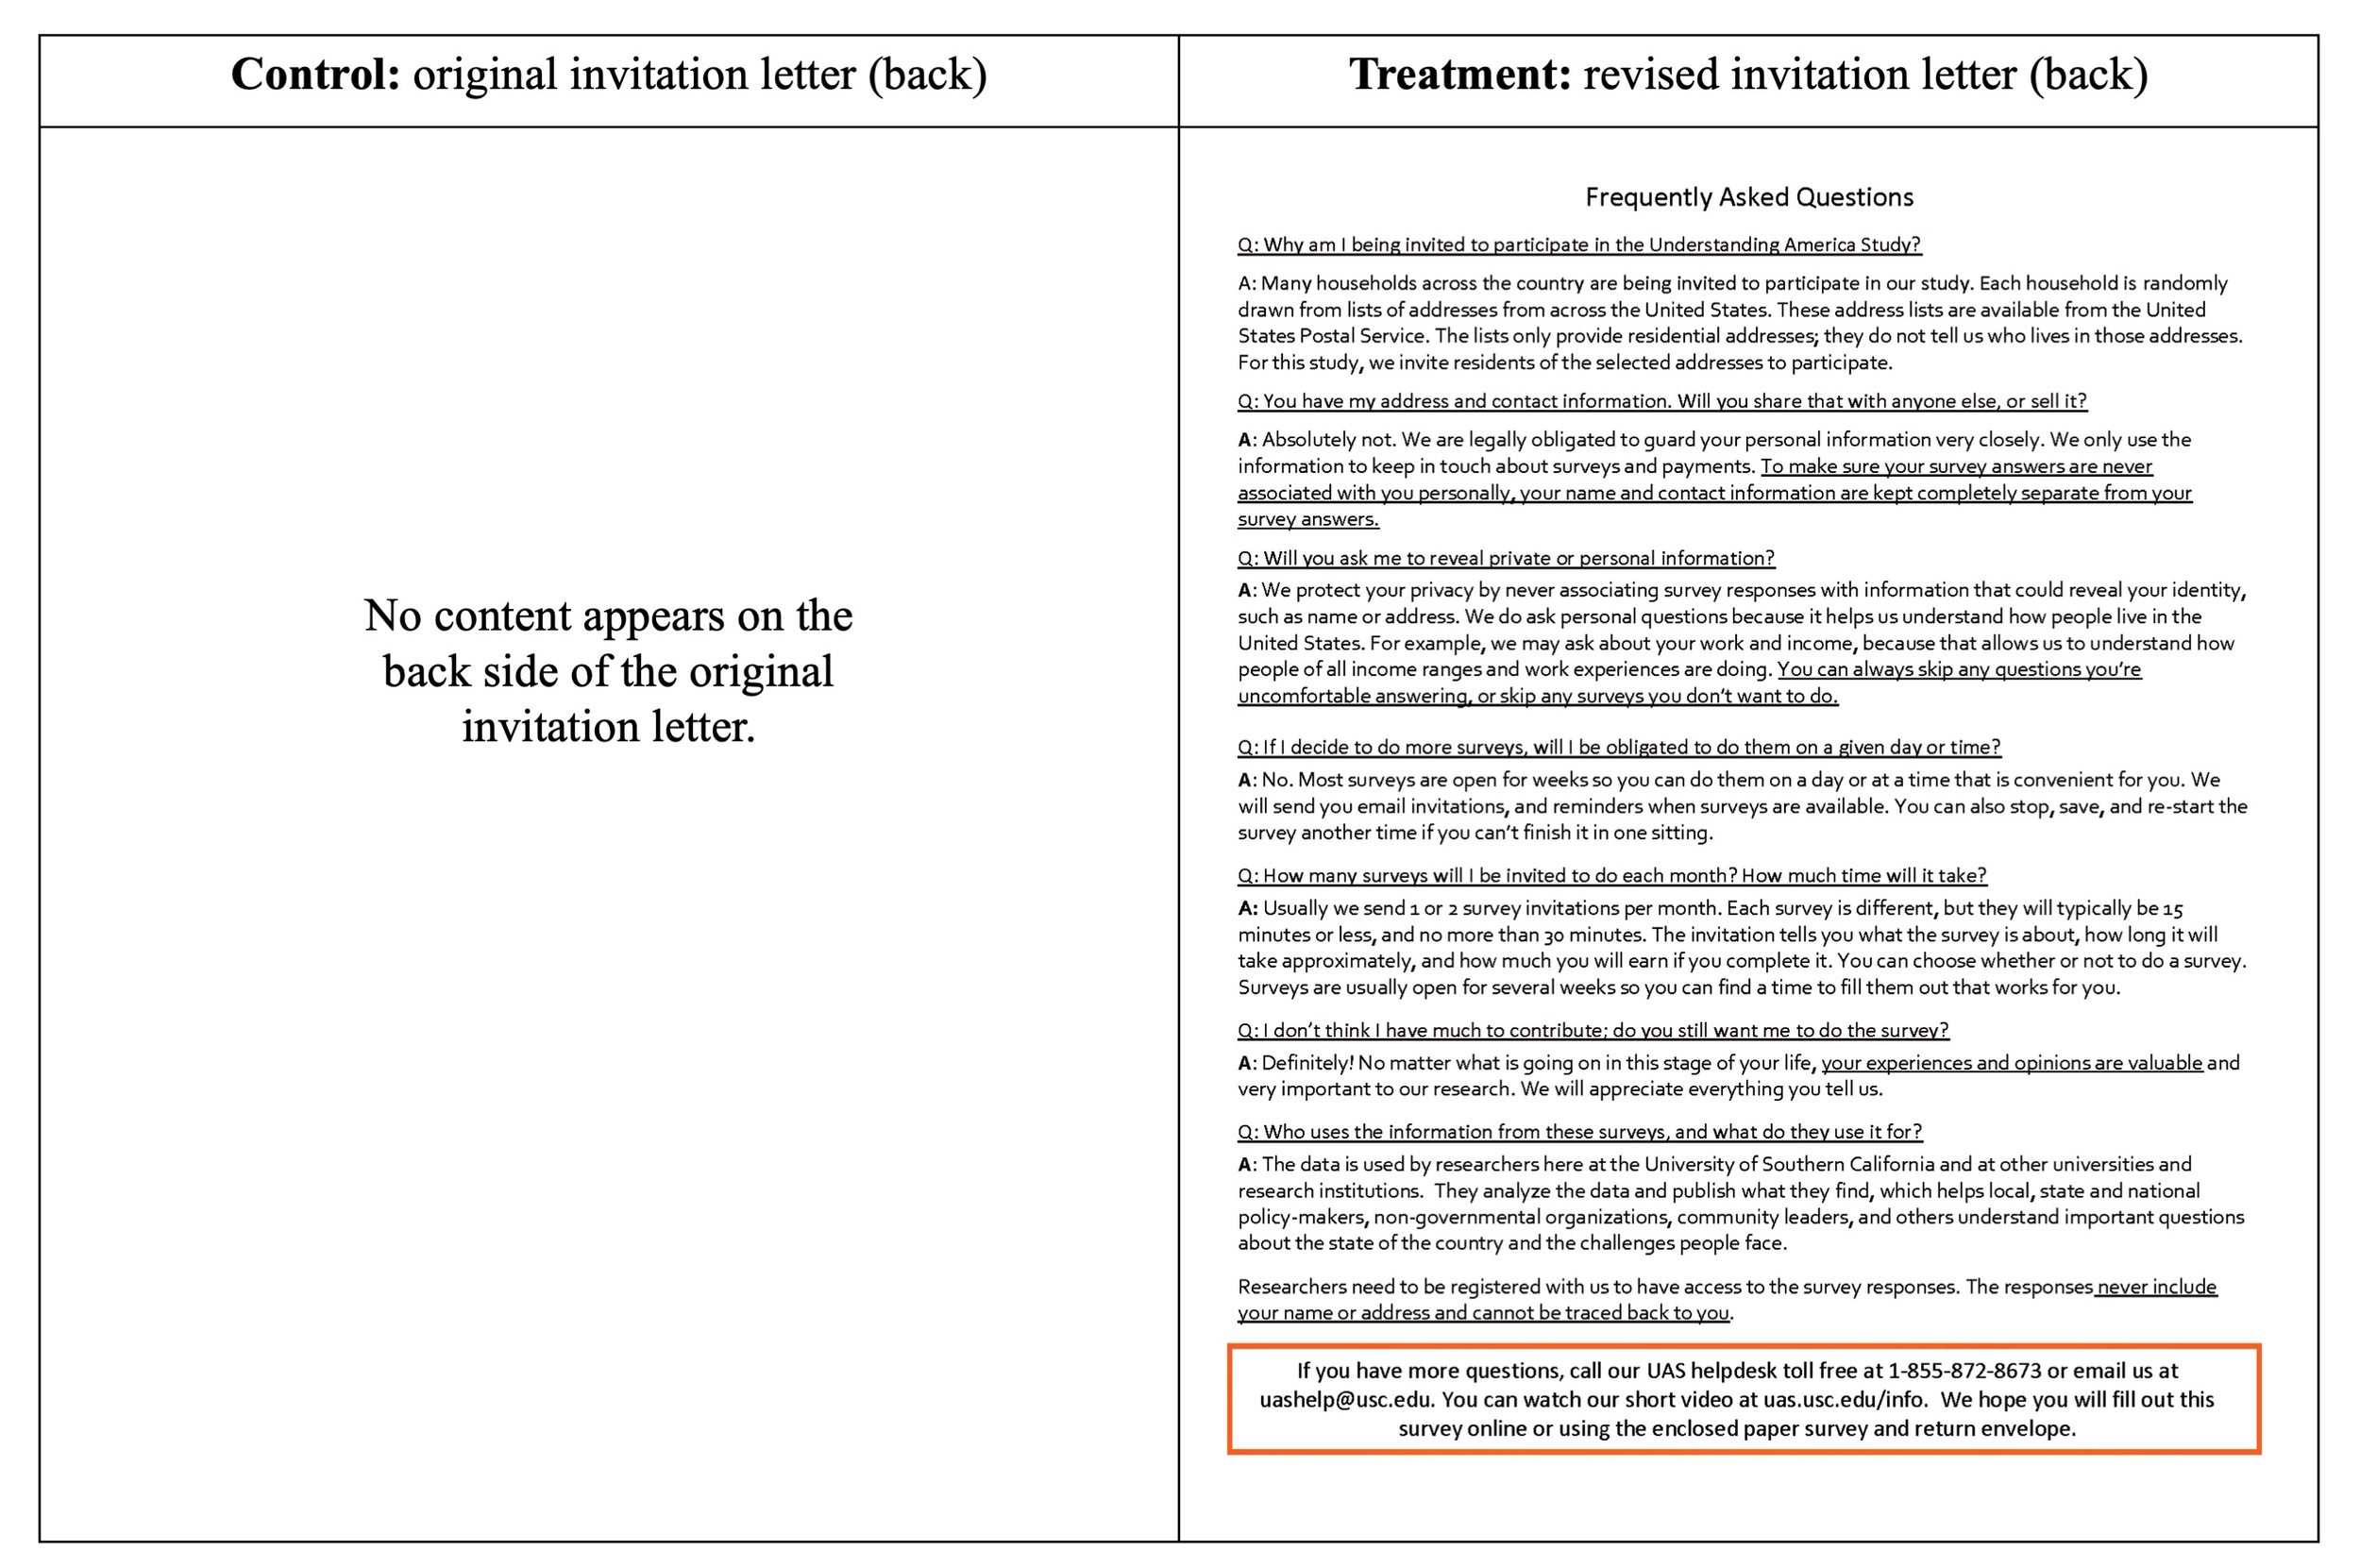
In response to this feedback, a number of critical revisions were made to the invitation letter. First, the text was shortened and the signposting of key content, in the form of bold headings, was introduced. Second, an explicit mention of the opportunity for further paid surveys was added. Third, a QR code was incorporated. Fourth, FAQs about the panel and data privacy were printed on the reverse side of the letter, and an indication to consult them was added to the letter text. On the basis of additional feedback from the interviews on the revised letter and newly developed FAQs, further adjustments were made, including using the University and not the departmental logo on the letterhead for increased recognition, further clarifying the payment amounts for surveys, centering the placement of the QR code in the letter, and removing mentions of ‘membership’ to the study. Table 1 summarizes the changes to the recruitment materials informed by the focus groups and individual interviews. Figures 1 and 2 present the original and revised versions of the invitation letter and FAQs, respectively.
Evaluation: Randomized Experiment
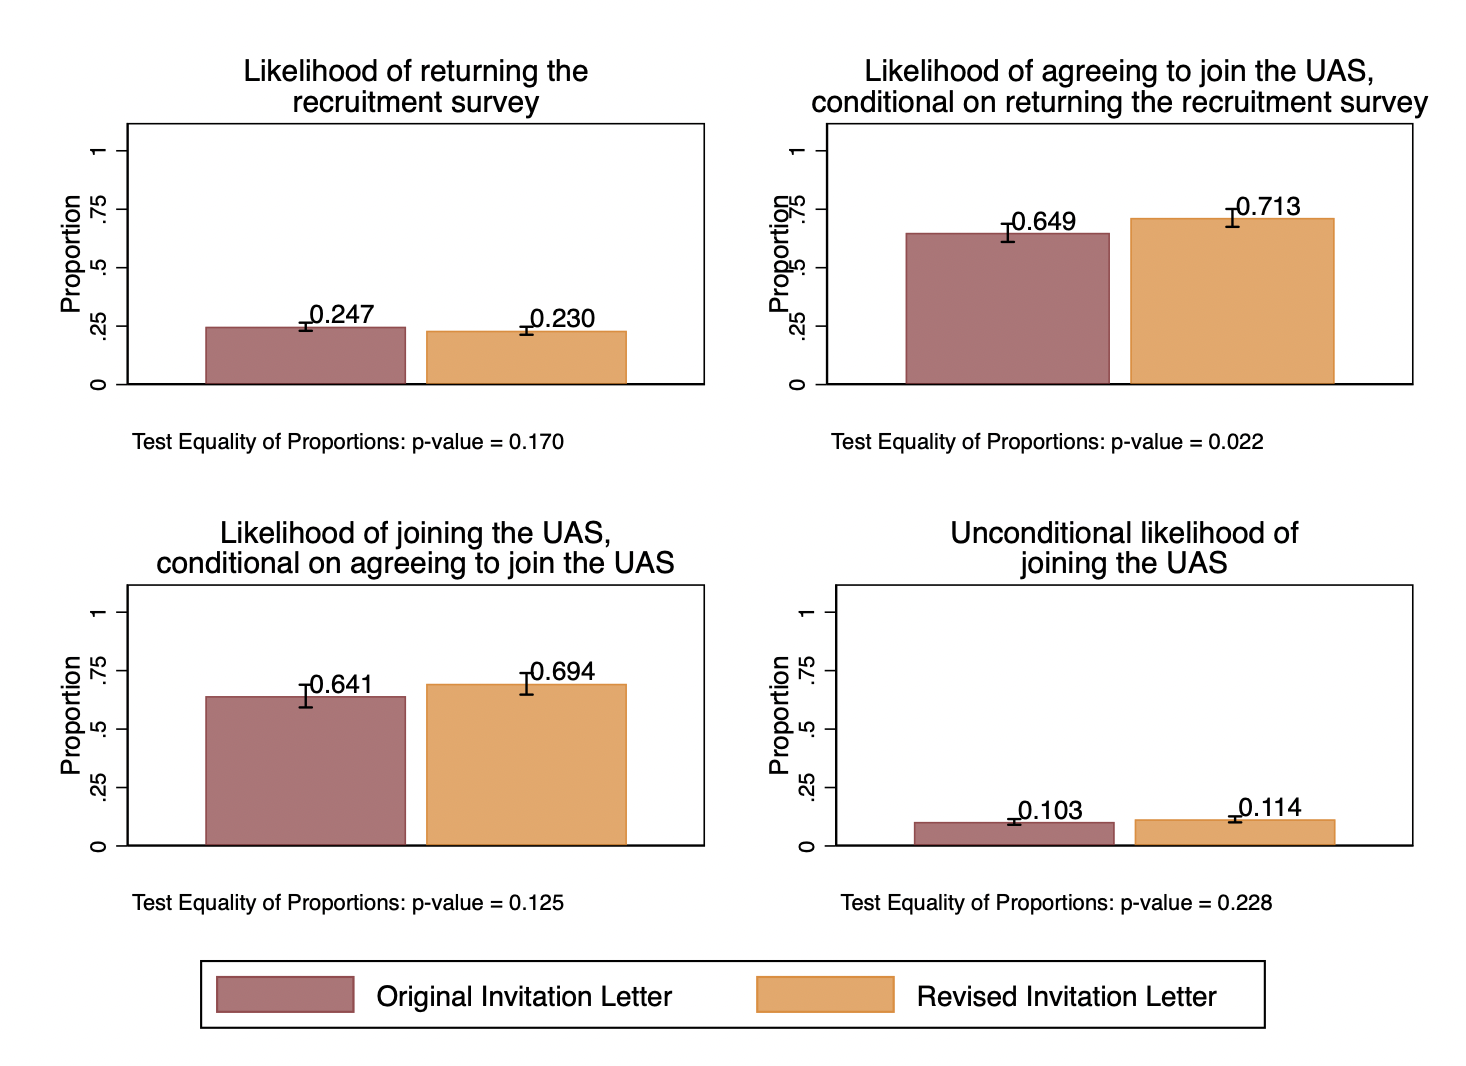
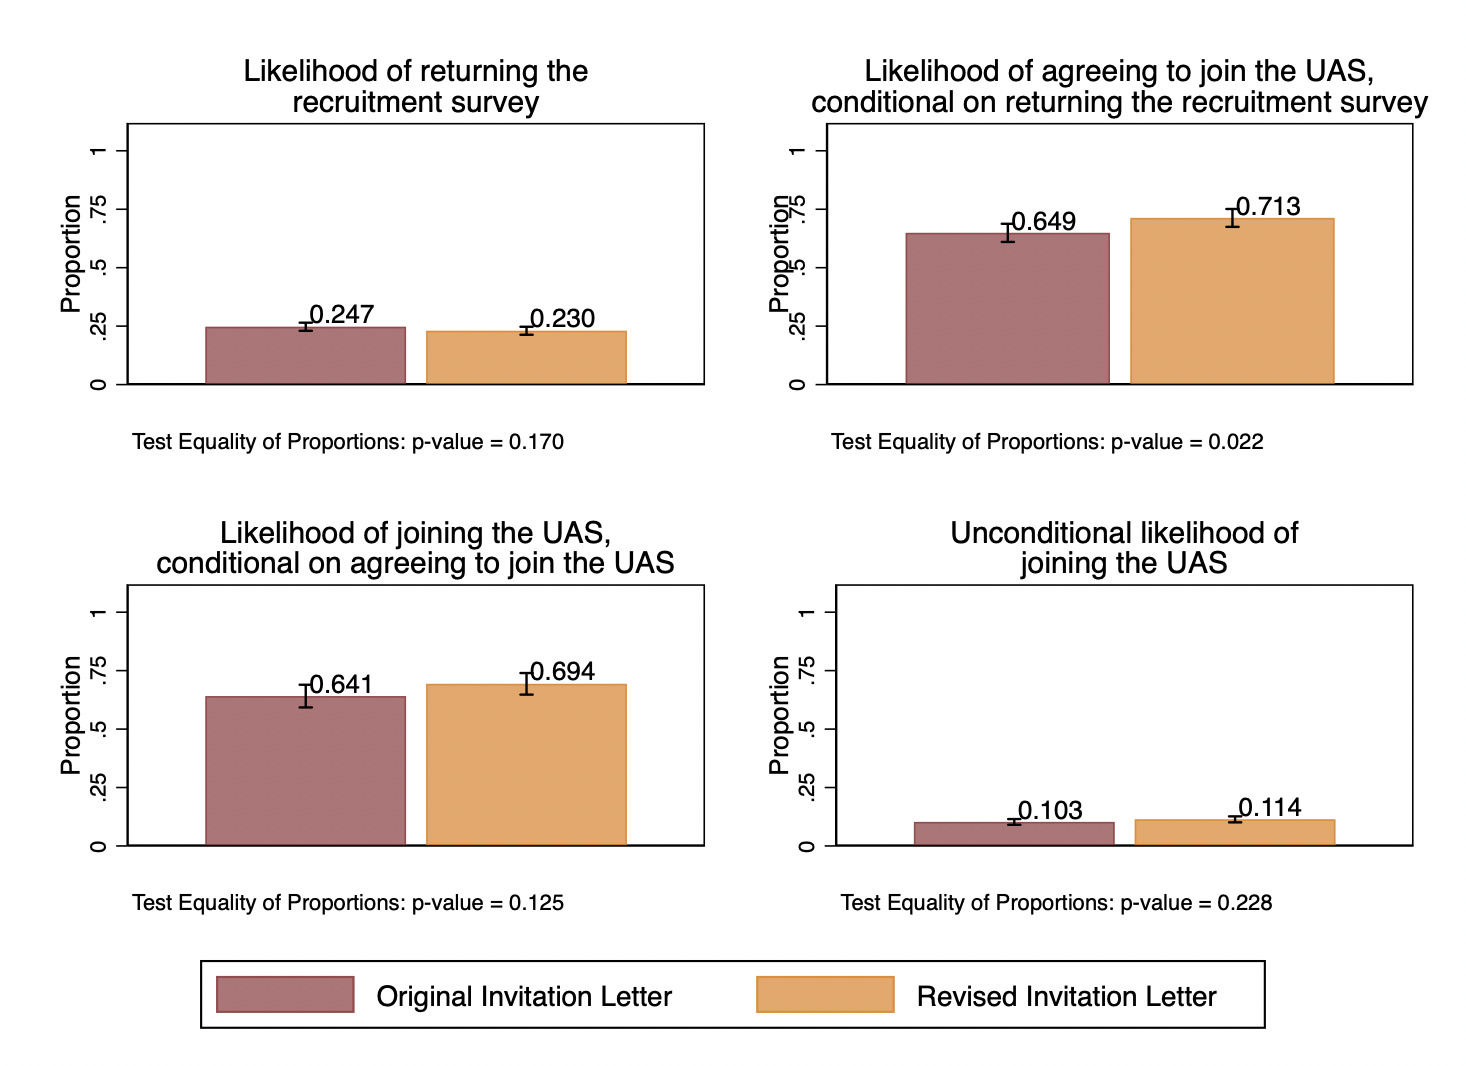
Figure 3 compares the recruitment rates for those who received the revised and the original invitation letters. The overall rates did not differ across groups: 11.4%, 95% CI = [0.100, 0.126], for the revised letter group, and 10.3%, 95% CI = [0.090, 0.115], for the original letter group (t(4706) = 1.206, p = 0.228). When broken down by recruitment stages, there was no difference in the return rates of the recruitment survey (t(4706) = –1.373, p = 0.170). However, among those who returned the survey, the revised letter group was more likely to agree to join the panel: 71.3%, 95% CI = [0.675, 0.751], for the revised letter group, 64.9%, 95% CI = [0.610, 0.687], for the original letter group (t(1122) = 2.300, p = 0.022). The rate of joining the panel among those who agreed to join was not significantly different: 69.4%, 95% CI = [0.647, 0.739] for the revised letter group, and 64.1%, 95% CI = [0.592, 0.689], for the original letter group (t(762) = 1.536, p = 0.125).
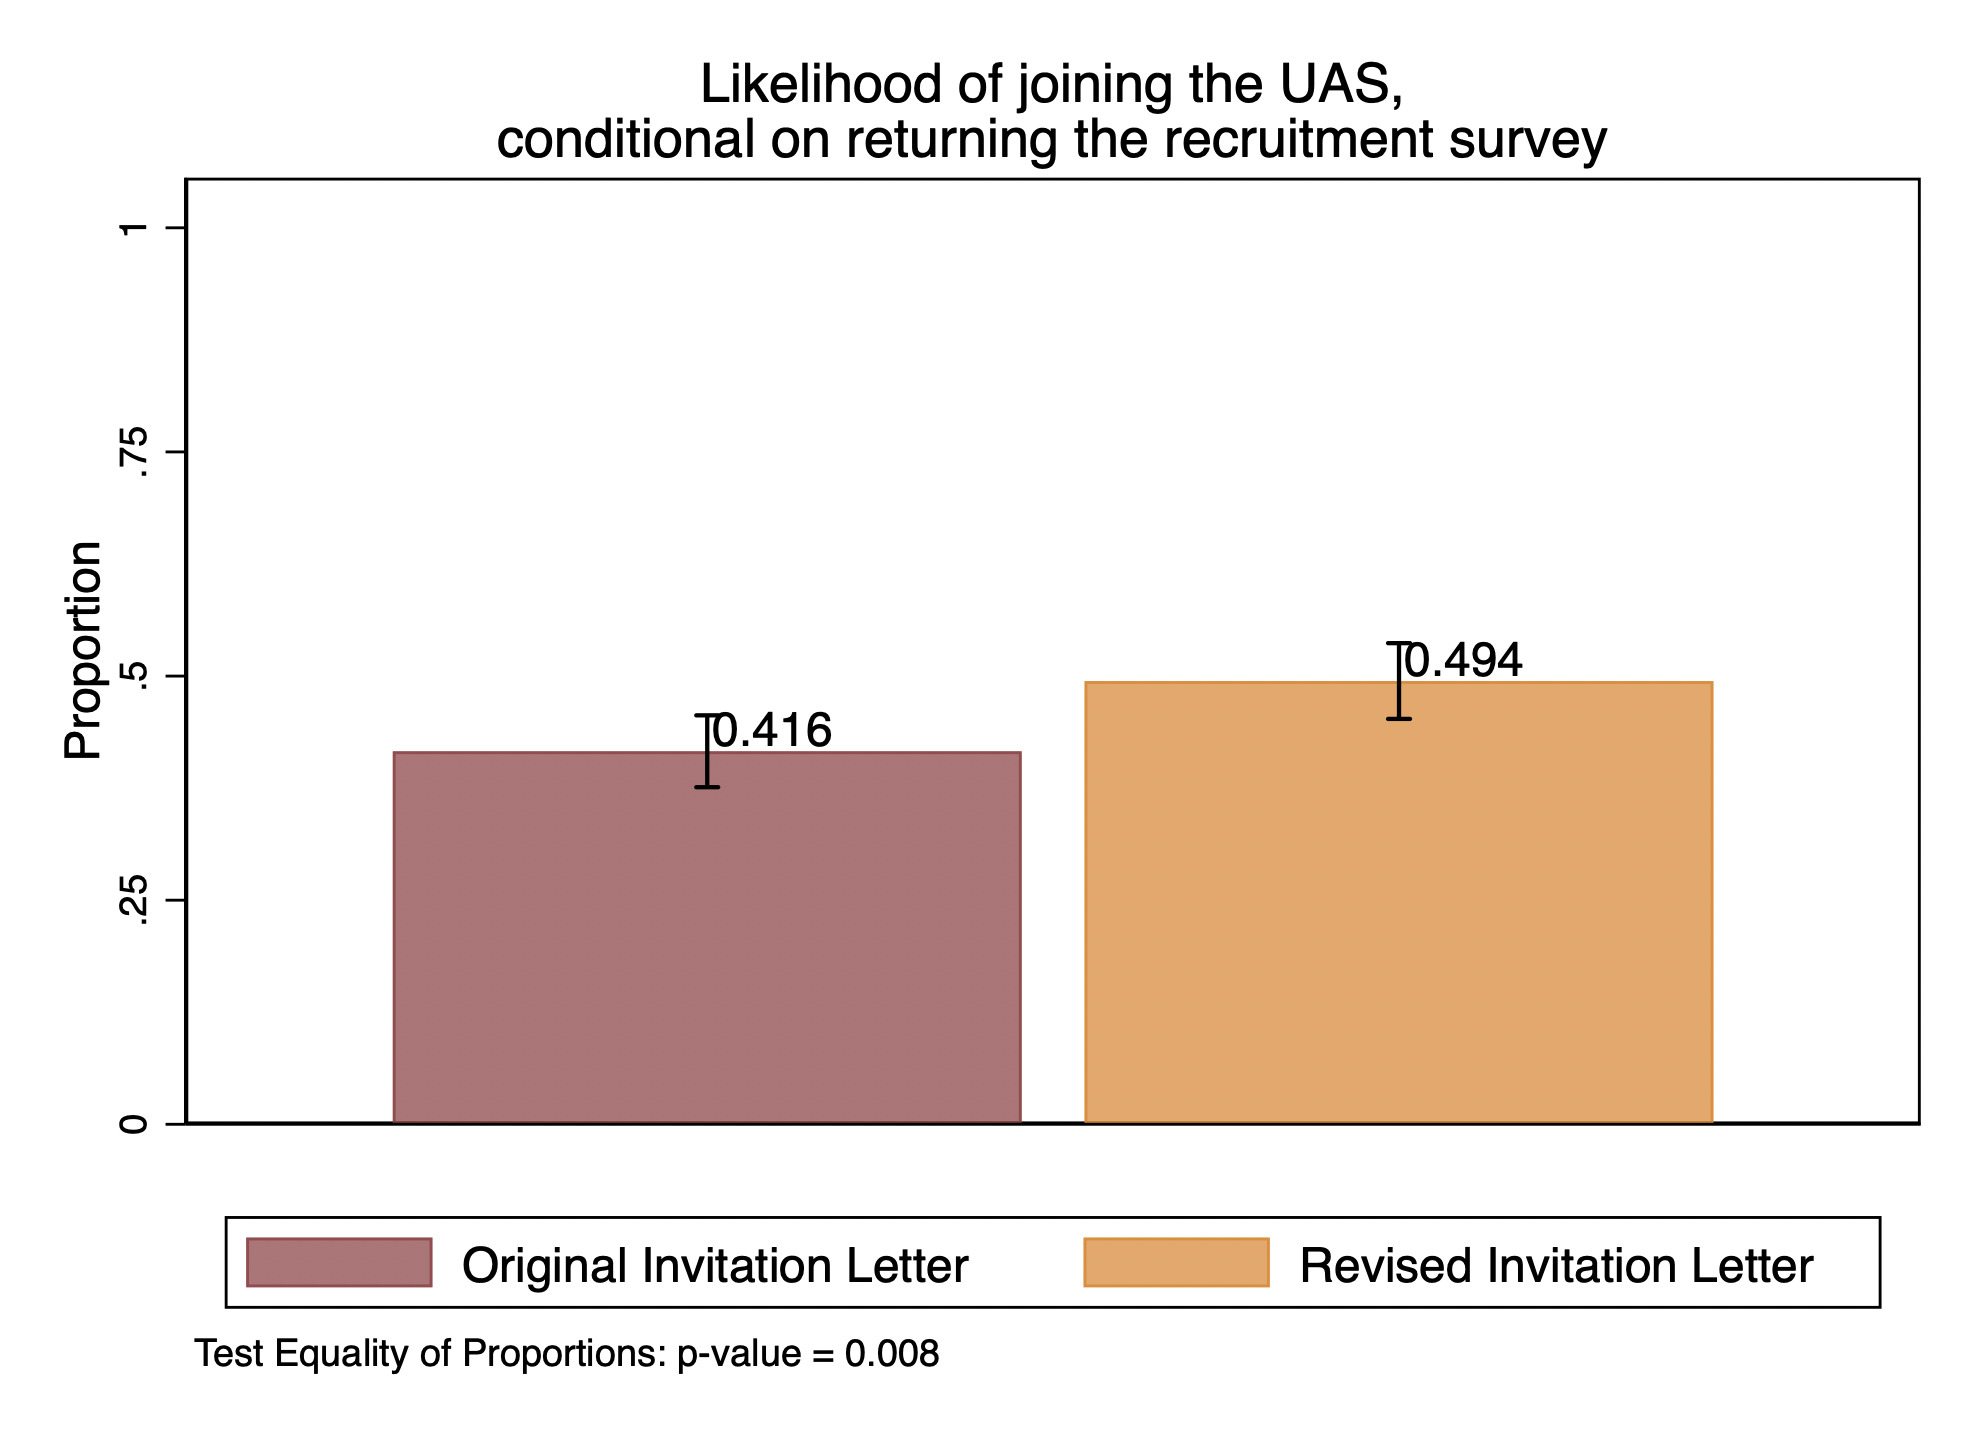
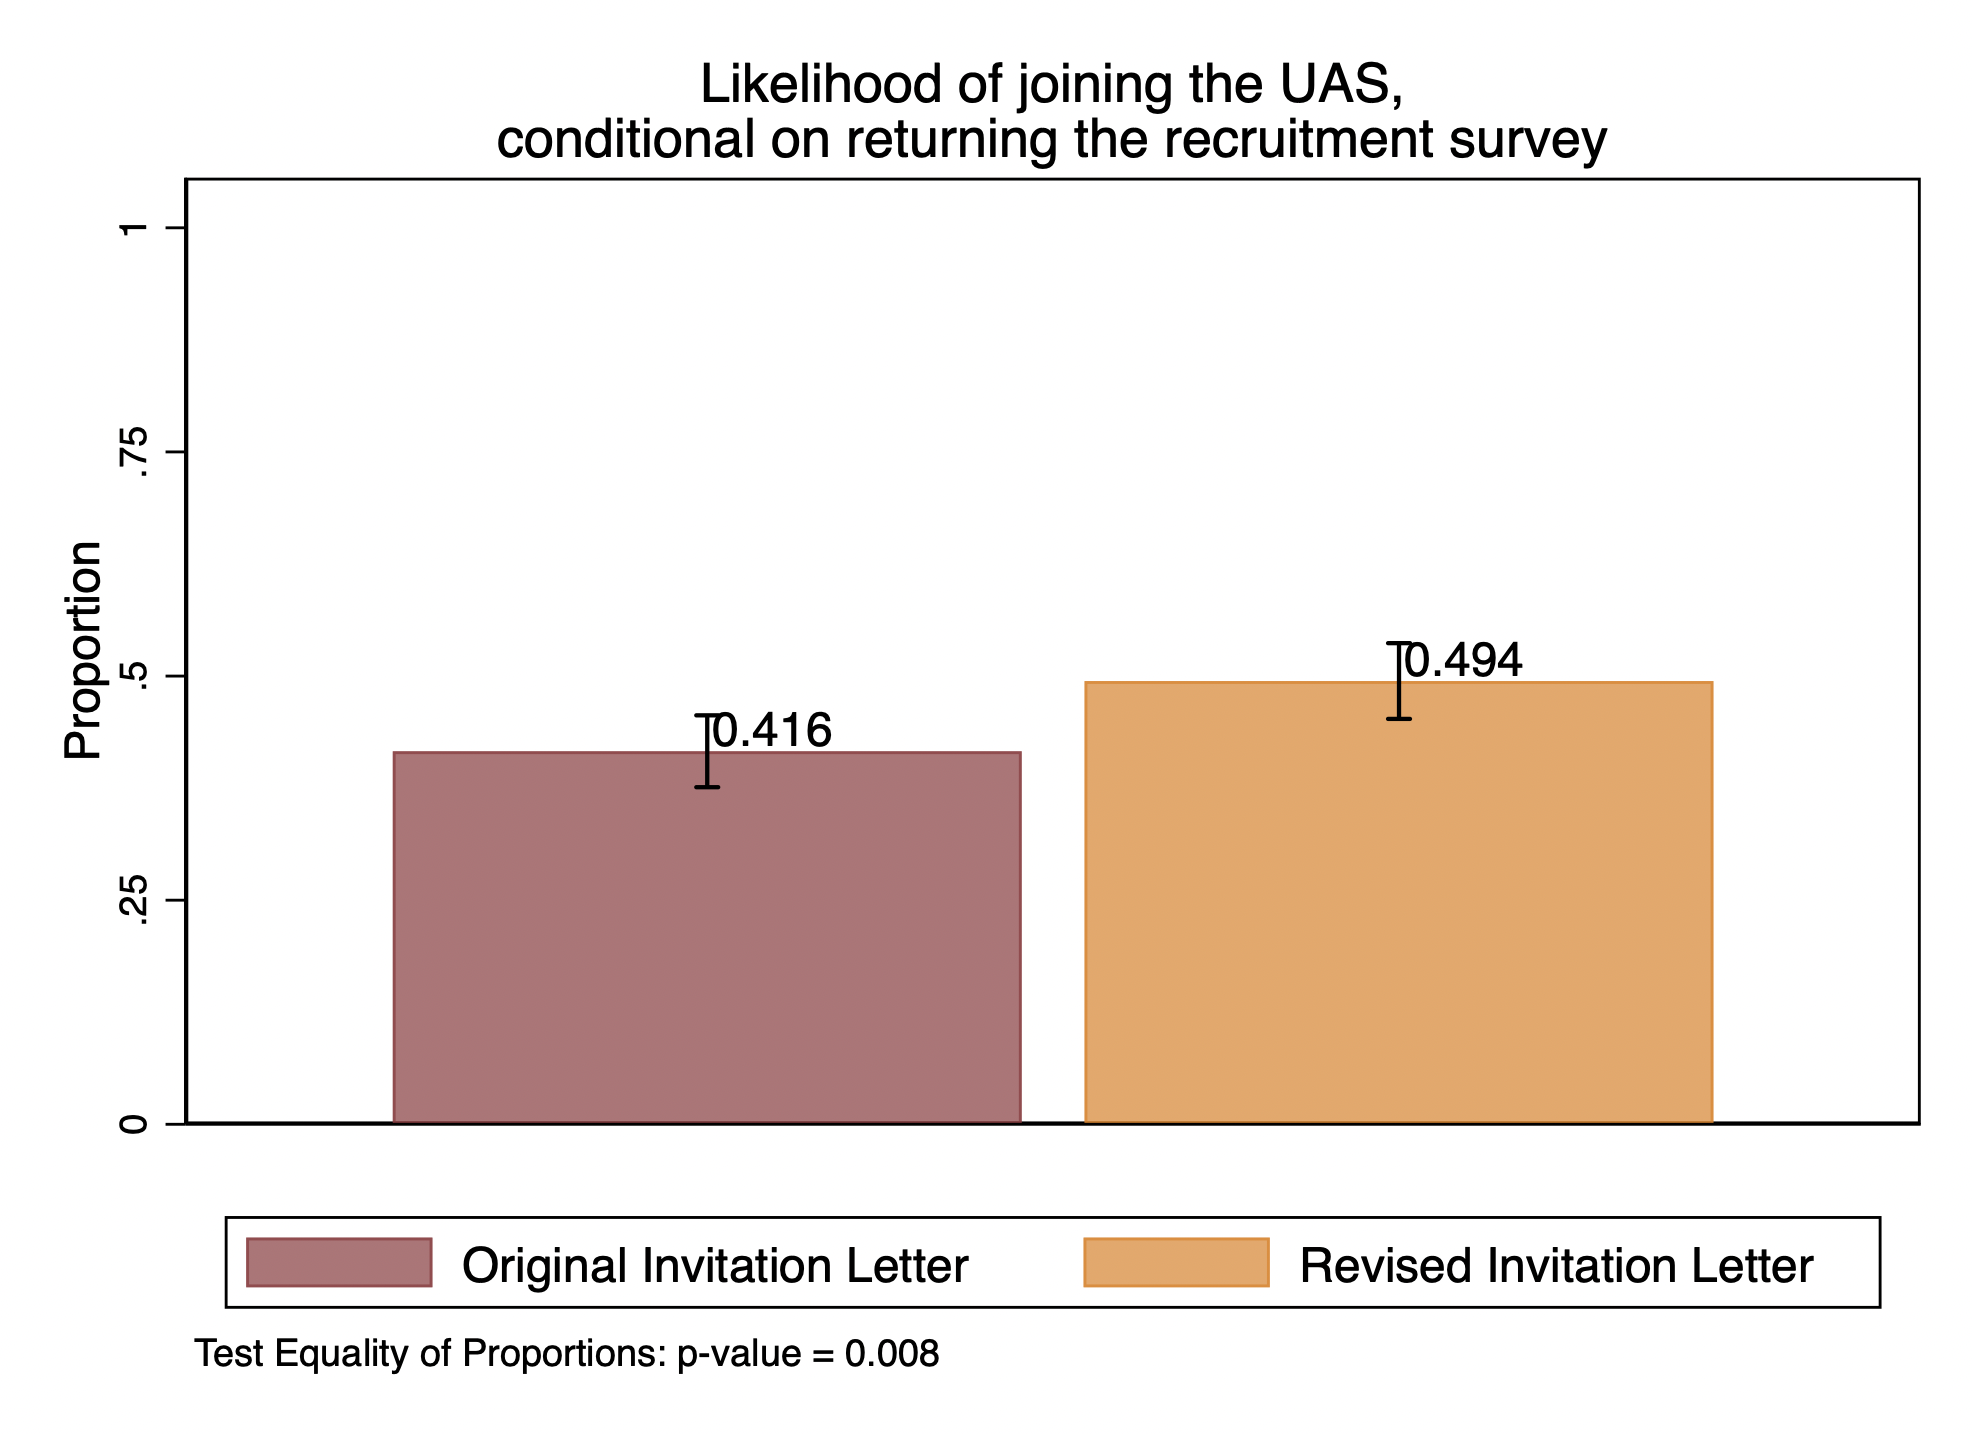
Mediation analysis further examined the extent to which the completion mode of the initial recruitment survey (online or paper) would mediate the impact of the revised letter on the empanelment rate. The results are reported in Table 2. Conditional on returning the recruitment survey, individuals who received the revised letter were 7.8 percentage points (95% CI = [0.013, 0.142], p = 0.008; 49.4% vs. 41.6%) more likely to join the panel, compared to those who received the original paper+web invitation letter.[4] Their higher likelihood to return the initial survey online (56.9% vs. 46.6%) significantly mediated the higher empanelment rate, explaining 3.6 percentage points (95% CI = [0.012, 0.060], p = 0.002) or 46% of the total effect. The remaining difference, potentially channeled through other mechanisms, was no longer significant (p = 0.130).
Demographic characteristics of empaneled members who received the original and revised letters are presented in Table 3, alongside population estimates based on 2022 Current Population Survey (CPS) data. Differences between the original and revised letter groups are small, with the only marginally significant difference being that the original letter group had higher household incomes (χ2 = 7.337, p = 0.062). Compared to population benchmarks, the recruited sample includes a higher proportion of women and individuals with higher levels of education. The lower representation of white respondents reflects the UAS sampling algorithm, which gives greater inclusion probability to racial and ethnic minorities.
Discussion and Conclusion
In this paper, we leveraged qualitative pre-testing to inform revisions of panel recruitment materials, specifically an invitation letter and newly developed FAQs, with the goal of improving information comprehensiveness and clarity, inclusivity, and participant engagement. We then experimentally evaluated the impact of the revision on recruiting participants to a nationally representative survey panel. The qualitative approach, combining focus groups with in-depth interviews, provided a structured way to uncover comprehension problems, jargon, and perceived burden, enabling targeted revisions prior to deploying the materials. Informed by participant feedback, the invitation letter’s text was shortened and key points highlighted with bold headings, the opportunity of future paid surveys was emphasized, a QR code was included, and a reference to the FAQs, provided on the letter’s reverse side, for details on data use was added. While shortening and improving the clarity of recruitment materials mirrors the efforts of other studies, participation and data privacy concerns can vary across different panels, justifying future use of qualitative testing in order to tailor specific components of the recruitment package.
In the randomized experiment assessing whether the revised invitation letter improved recruitment outcomes, individuals who received the revised letter were more likely to agree to participate (71.3% vs. 64.9%) and more likely to be empaneled (49.4% vs. 41.6%) among those who returned the recruitment survey, despite no difference in the unconditional empanelment rate. Mediation analysis further revealed that the primary pathway for these differences was the revised invitation letter pushing more participants to complete the initial recruitment survey online (versus in paper), accounting for 46% of the 7.8 percentage point increase in the empanelment rate in the revised recruitment materials group. Despite differences in recruitment rates, there were no significant demographic differences between those who joined the panel via the original and revised letters.
This work is not without limitations. Each individual change in the recruitment letter, including the added FAQs on the reverse side, was not varied in isolation, preventing us from identifying which element of the revised materials was responsible for the observed effects. Maintaining enough statistical power to test each element of the revised materials separately would have required a recruitment batch that was approximately four times as large, which was not financially feasible. The fact that increased online recruitment survey uptake mediated a significant portion of the effect of the revised letter may point to the inclusion of the QR code as the most consequential change. However, the QR code was not personalized in the recruitment batch designated for the experiment, and as such, we were unable to track who used the QR code to access the recruitment survey (something that was remedied in later batches).
Our experience suggests several lessons for applying mixed-methods approaches to the development of recruitment materials in other contexts. First, the sequential design – using focus groups to surface broad issues, followed by interviews to probe line-by-line comprehension –proved particularly effective in identifying both high-level concerns (e.g., legitimacy, privacy, burden) and granular wording or formatting problems. Other projects could benefit from a similar structure, especially when recruitment materials must serve diverse populations with varying concerns, levels of literacy, and digital familiarity. Second, our findings underscore the value of explicitly testing visual and structural elements (such as signposting, QR codes, and placement of key information), which participants discussed as much as the substantive content. Incorporating early qualitative input on layout may help teams avoid costly revisions later in the process. Third, our work highlights the importance of anticipating how revised materials might shift respondent behavior across recruitment pathways (e.g., toward greater online completion) and planning experiments that can measure such mechanisms. More broadly, we recommend that researchers designing similar studies allocate time for iterative refinement, engage subgroups with historically lower participation, and document which components of the materials most clearly reflect participants’ expressed needs. These practices align with broader methodological guidance emphasizing user-centered, theory-informed design of recruitment communications (Dillman, Smyth, and Christian 2014). While substantial improvements in recruitment rates remain difficult to achieve, by applying these principles, probability-based panels can more effectively tailor materials to their target populations and strengthen the overall impact of their recruitment strategies.
Corresponding author contact information
Marco Angrisani
University of Southern California, Center for Economic and Social Research and Department of Economics. 635 Downey Way, Los Angeles, CA 90089, USA. Email: angrisan@usc.edu
UAS statement
The project described in this paper relies on data from survey(s) administered by the Understanding America Study, which is maintained by the Center for Economic and Social Research (CESR) at the University of Southern California. The content of this paper is solely the responsibility of the authors and does not necessarily represent the official views of USC or UAS.