1. Introduction
“Only a fraction of time spent on Meta’s services - 7% on Instagram, 17% on Facebook - involves consuming content from online ‘friends.’ A majority of time on both apps is watching videos, increasingly short-form videos that are ‘unconnected’ - i.e., not from a friend or followed account - and recommended by AI-powered algorithms.” - Federal Trade Commission v. Meta Platforms, Inc. (2025)
TikTok’s meteoric rise has redefined social media platforms. Versions of TikTok’s algorithmically curated feed of videos have been adopted by other social media companies, including Instagram and Facebook (Reels) and YouTube (Shorts). In 2024, 33% of American adults reported using TikTok, with 59% of those aged 18-29 using the platform (Sidoti and Dawson 2024). Short video platforms (SVPs) show users a series of videos generated explicitly by algorithmic recommendations, allowing users to rapidly consume high volumes of video from a range of creators. One study found that over a six-month period, TikTok users saw a median of just over 42,000 videos (Merrill et al. 2025).
Capturing nuanced variation in time spent on these novel platforms is crucial to social media research. My research seeks to better assess SVP use by developing and testing best-practice self-report measures that capture both frequency and duration of social media use with just a few items. First, I explain why measuring these concepts separately is particularly important for understanding SVPs. Then, I draw on cognitive interviews to show that users conceptualize their SVP usage using these dimensions. Finally, I present data from a sample of iPhone users to compare my measure of SVP usage against screenshots of iOS Screen Time Reports and two other existing measures. I present descriptive statistics of SVP use and test reporting error. The novel items successfully capture greater variation in user behavior by differentiating frequency and duration, without sacrificing accuracy.
2. New Measures for New Social Media
Social media usage has two dimensions: frequency (how often the platform is used) and duration (time spent per use). Both dimensions are critical for understanding SVP usage because they individually affect the extent to which platform usage encourages and maintains focus, which in turn is key to affecting attitudes and behaviors, but this is not captured in conventional items. Video can be much more engaging and emotionally charged than written word (Yadav et al. 2011) and emotionally arousing videos are most likely to “go viral” (Nelsen and Petsko 2021). While attention to any media is associated with an increase in deliberate learning and interpersonal communication, short-video was found to have a stronger relationship compared to long-video and text-based media (Fu et al. 2024). Taken together, this evidence suggests that when people are deeply engrossed in a platform, the content they see is more likely to have downstream effects on attitudes and behavior. Therefore, it is critical to be able to differentiate users who log in for short bursts on a platform throughout the day from those who have focused, devoted time. Many survey items (see Appendix Table A1) are designed to capture only frequency or duration, or they capture overall time on the platform. While reducing usage to a single measure can decrease respondent burden and minimize survey space, it diminishes measurement of useful variation.
In addition to space, the effectiveness of survey measures of social media time use is limited. Self-reported social media use, internet, or smartphone use measures are subject to high levels of error, particularly among those who use these technologies the most (Araujo et al. 2017; Boyle et al. 2022; Ernala et al. 2020; Molaib et al. 2025). Goetzen et al. (2024) find in a study focused on TikTok specifically, having a higher number of sessions is associated with lower estimates of time spent on TikTok and positively associated with accuracy. While Goetzen et al. (2024) did not ask users about perceptions of pick-ups, the finding suggests that higher frequency users perceive use differently than longer duration users. Ernala et al. (2020) find that people generally over-report the amount of time that they spend on the platform while under-reporting how many times they visited. In their findings, phone pick-up frequency and overall use are distinct concepts.
Advances such as iOS Screen Time data donations can equip researchers with more objective measures of time with social media platforms open, but this solution remains limited. Dependency on objective tracking data limits the sample to individuals with compatible devices who are willing to share potentially detailed device data with researchers (Ohme et al. 2021; Silber et al. 2022) and introduces external sources of error. While these devices track how long a program is open on a respondent’s phone, they do not track user attentiveness, potentially overestimating use. Well-designed self-reports remain crucial despite advancements in digital data donations.
In the measure, all respondents are first asked to indicate which platforms they used in the past year, then asked about the frequency and duration for each platform (see Table 1 and Appendix Table A2). To decrease respondent burden, respondents were only asked follow-up items for a limited set of platforms.
In addition to separating dimensions, allowing for reduced cognitive load, the measure incorporates several best practices. First, the design asks about specific platforms individually. While Burnell et al. (2021) find that respondents over-report on every platform, Scharkow (2016) finds that respondents are more accurate about the use of specific platforms. Additionally, the items are closed-ended, aligning with Ernala et al. (2020)’s finding that respondents are more accurate answering closed-ended social media self-report items. Finally, the novel items ask about typical experiences and average use, since users are more accurate when asked to estimate their use over larger time periods (Araujo et al. 2017; Molaib et al. 2025).
3. Cognitive Interview Testing
Prior to fielding, the entire instrument was tested via 15 cognitive interviews (CIs) (see Appendix Section: Cognitive Interview Sample for participant demographics). Cognitive interviewing is used to refine and clarify survey questions by identifying disconnects between what respondents understand and what the researcher intends for them to understand (Willis 2015). Following best-practice methodology, think-aloud questions were used for recall items such as time spent online. Additional question-specific probes, which asked respondents to define or restate items, were used for items that hinged on respondent understanding (Blair and Conrad 2011). Unlike other research methods, CIs are conducted iteratively, making frequent changes between interviews to adapt the survey (Caporaso and Presser 2024). For this study, five survey drafts were tested.
3.1. Refining Item Wording Through Cognitive Interviews
The first iteration of social media frequency leveraged a single item with many frequency options. However, early CI respondents indicated the response list was overwhelming. To decrease respondent burden, the item is split rather than removing response options. Further, multiple CI respondents explained that this item required approximating an average across an entire day, because use varies depending on work or school obligations. The use of “about” decreased respondents’ anxiety about answering the item incorrectly.
For the duration battery, CI data indicated a need for revisions to the response options. The initial response options were “about five minutes,” “about fifteen minutes,” etc., up to 2 hours. Multiple respondents expressed a desire to situate themselves within a range, rather than select the closest approximate interval. Respondents consistently indicated their durations verbally using a range and resisted rounding.
3.2. Qualitative Validation of Multi-Dimensional Social Media Use
The CIs also validated the two dimensions (frequency and duration) of social media use. Multiple respondents described using one platform, often Instagram, multiple times throughout the day, but for short intervals (e.g. checking in to see updates or sending or responding to a message). These same respondents would describe using another platform, often TikTok, fewer times throughout the day but for much longer intervals. Respondents described spending extended periods of time on TikTok when they woke up and before bed. These use patterns paint different pictures of the platforms’ function. One platform is ingrained throughout someone’s day whereas the other platform received dedicated time and focus.
4. Empirical Test of the Novel Measure
This section presents the results of a survey (N=660) testing the novel battery by directly comparing it to existing measures as well as benchmarking data donations of iOS Screen Time data. Survey participants were randomly assigned to one of three social media self-report collection methods. In Treatment 1, respondents were assigned the novel measure. In Treatment 2, respondents were assigned the single-item self-report measure used in the American National Election Studies (ANES). Finally, respondents assigned to Treatment 3 were assigned to the most accurate self-report measure in a large study by Ernala et al. (2020), referred to as the Existing Best Practice (EBP) (see Appendix Table A3 for full wordings). After completing the self-report measures, all respondents uploaded a screenshot of their screen time usage, including time spent on social media platforms.
The survey was fielded from April 24 - 28, 2025, on CloudResearch. To enable comparisons, respondents were required to be iPhone users, social media users, and willing to share iOS Screen Time data. At the end of the survey, respondents were provided instructions to submit Screen Time screenshots. Out of an initial 884 respondents, 156 either did not provide a screenshot or submitted incorrect screenshots, and another 60 did not have tracking enabled on their iPhone. Thus, the final sample consists of 660 respondents (novel condition n=229, ANES condition n=220, EBP condition n=211).
4.1. Survey Descriptive Statistics
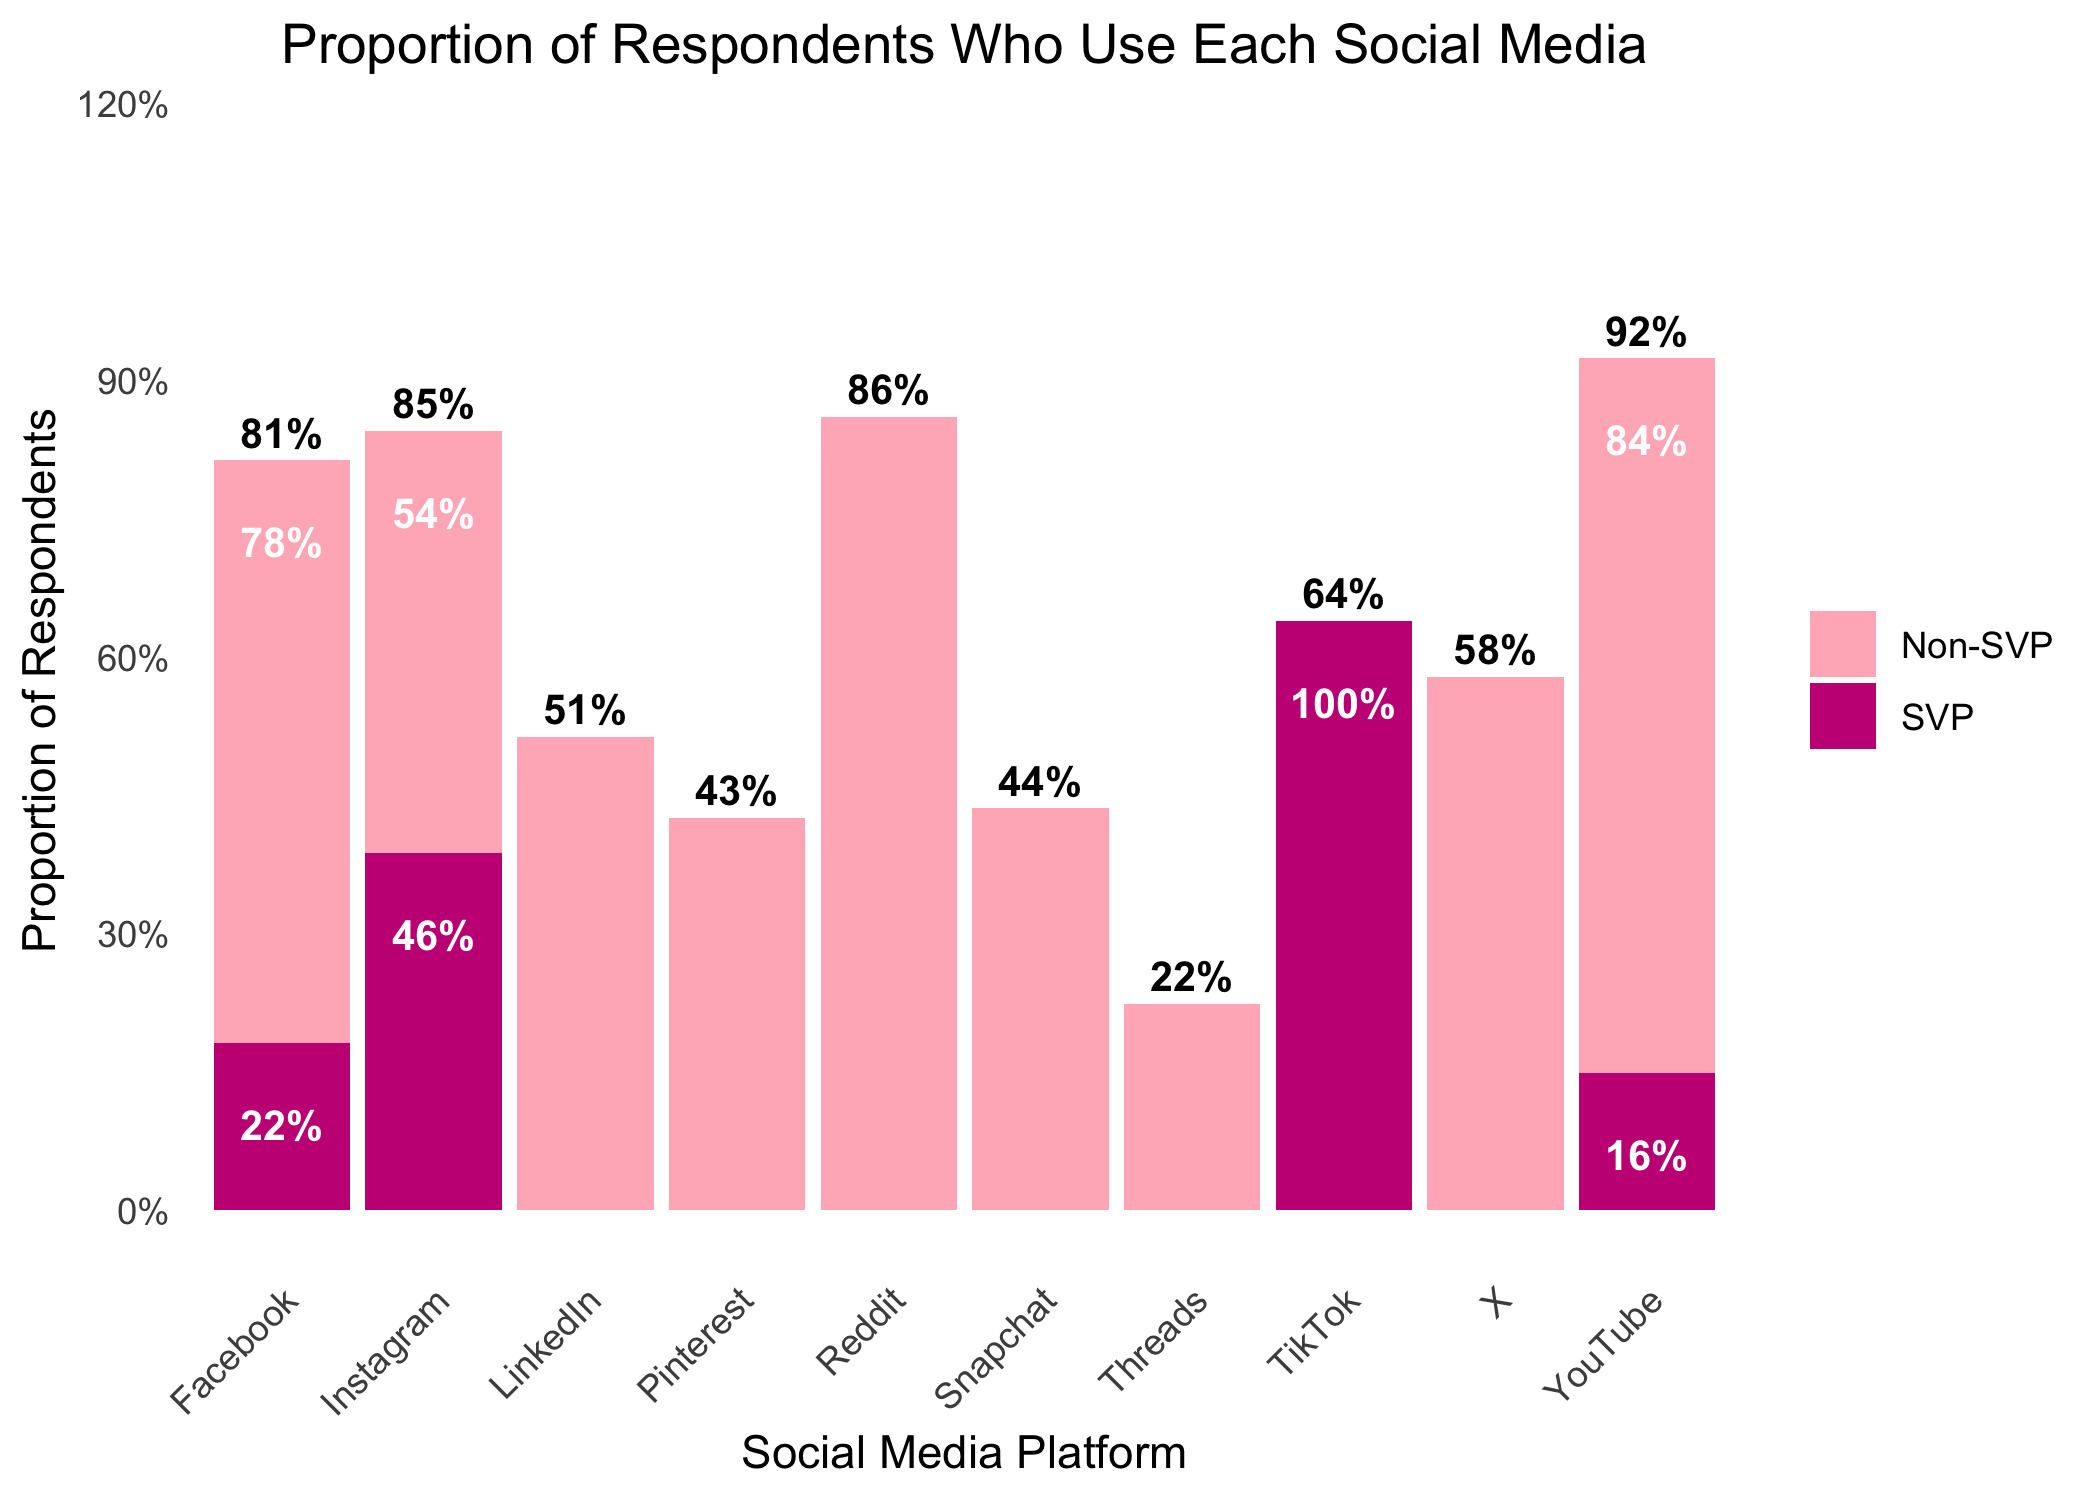
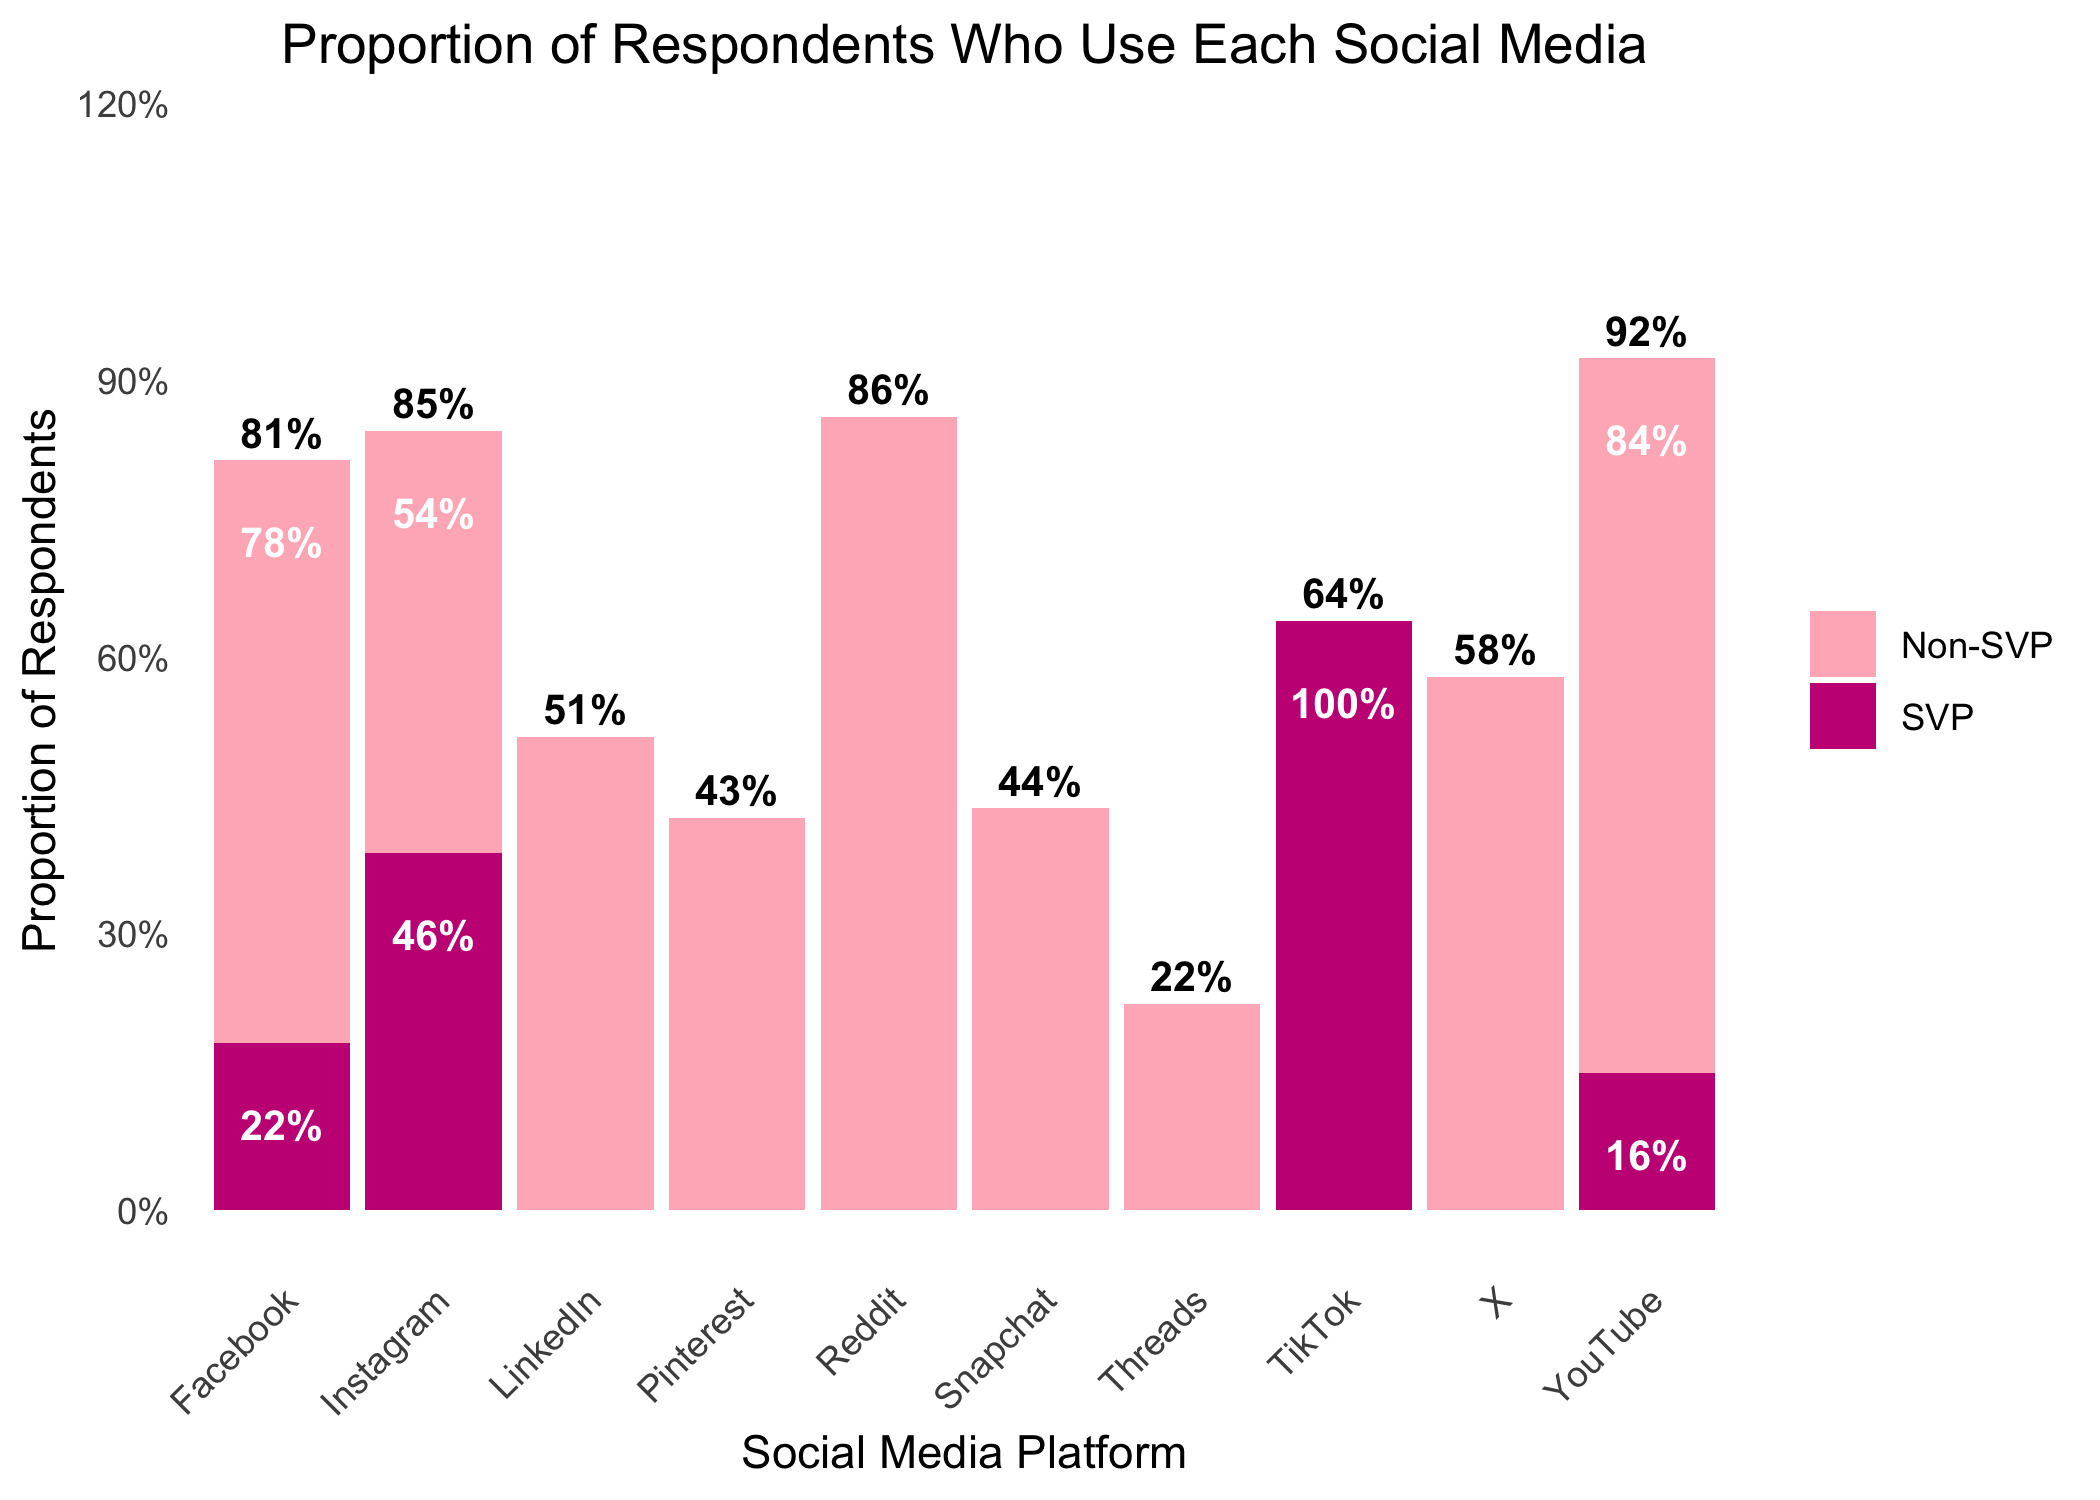
YouTube (92%), Reddit (86%), Instagram (85%), and Facebook (81%) were the most frequently used platforms. Since Facebook, Instagram, and YouTube are multi-mode platforms, a follow-up item asking "About how much of your time on
[Platform] is spent viewing [Reels/Shorts] (short videos)?" is used to determine if the platform is classified as SVP. Users who responded to this item with about half or more are classified as SVP users. Instagram has a greater proportion of SVP users (46%) than Facebook (22%) and YouTube (16%). All participants who reported using TikTok use are coded as SVP users. Overall, 83% of respondents use at least one SVP.
Older respondents are significantly less likely to use an SVP than respondents who are 18-29: 95% of participants aged 18 to 29 use at least one SVP, compared to only 58% of those over the age of 60. Additionally, women are observationally more likely to be SVP users than men (88% vs 78%). Finally, partisans (D: 87%, R:86%) are observationally more likely to be SVP users than non-partisans (77%). Full demographic analyses are available in Appendix Table A6.
4.2. Treatment Accuracy Compared to Data Donations and Other Measures
This section directly compares the overall accuracy of total time spent from the novel measure and the two existing measures by benchmarking to iOS Screen Time values[1]. Error is computed in three measures: self-report absolute error, under-reporting error, and over-reporting error (Araujo et al. 2017). Due to skewness in the data, the logs of these errors were computed for modeling. Appendix Table A7 shows the results of a linear mixed-effects model predicting response error as a function of respondent and platform characteristics. Respondents are repeated in the data for each platform they use, with random intercepts used to control for respondent repetition. While there is some variation by treatment and other demographic traits, the strongest, most consistent predictor of error is the log of total weekly use (based on Screen Time data). Consistent with prior research, the greater the amount of time a respondent has the platform open, the greater their error in self-reporting.
The EBP measure is associated with a reduction in under-reporting error, but also a significant increase in overall and over-reporting error when compared to the novel condition. The ANES item is associated with slightly reduced over and under reporting error compared to the novel items. SVPs are associated with higher overall and over reporting error, though SVP classification has no relationship with under-reporting error. Taken together, the results demonstrate that the novel measure matches and sometimes exceeds existing measures in terms of overall accuracy.
4.3. Testing Multi-Dimensionality With Survey Data
Table 2 shows the average frequency and duration for each individual platform as well as an overall average for each platform type (SVP vs. non-SVP) for each respondent in the novel use condition (N=229). Average frequency and duration are both significantly higher on SVPs than on other platforms (see also Appendix Figure 1). Facebook and Instagram users who are SVP focused visit the platforms more frequently and use them for longer durations, though the same is not true for YouTube.
On average, each respondent provided data for 1.2 SVPs and 3.8 non-SVPs. A clustering analysis (described in Appendix Section 5: Table A8 and Figures 2 and 3) shows that SVPs are significantly more likely to be classified into high duration clusters than non-SVPs, emphasizing that SVP engagement likely involves extended duration.
5. Conclusion
The novel items developed and presented here enable greater depth in social media research by separating frequency and duration, an especially important insight when exploring usage patterns of fast-growing SVPs like TikTok and Instagram Reels. Additionally, while there is reason to believe that the dimensions will be more critical in SVP research, it is likely that variation along these dimensions would impact outcomes on other social media as well. For example, across multiple platform types, high frequency/low duration use is associated with using the platform to connect with others outside of the platform, whereas high duration/high frequency use is associated with finding the platform informative. High frequency and high duration are independently predictive of finding the platform entertaining, but being classified as both is associated with an even stronger increase.
The CIs reveal that respondents had high confidence and ease in responding to these multi-dimensional self-report items and the items’ values are verified with a survey experiment. Further, by leveraging CIs in the development process, respondent burden was decreased and respondent understanding of the items was verified. The survey experiment demonstrates that the novel items can be used without sacrificing accuracy compared to existing measures. Given their prevalence, not enough attention has been devoted to studying SVPs, but cognitive testing and experimentation can help to create more detailed measures of SVP usage.
Disclosure Statement
This research was made possible by a grant from the American Political Science Association. The statements made and views expressed are solely the responsibility of the author.
Corresponding author contact information
Sarah Elizabeth Hogenboom-Jones
sjones30@syr.edu, 200 Eggers Hall Syracuse, NY 13244
See Appendix Tables A4 and A5 for how frequency and duration were transformed into a total time spent value